



























The total crypto market cap (TOTAL) jumped on the back of US making history by approving the first federal crypto law in history. Bitcoin (BTC) benefitted from the same, sitting above $120,000. Following into BTC’s footsteps, Hedera (HBAR) also shot up today, rising by 22%.
In the news today:-
- BlackRock has filed to amend its Ethereum ETF to include staking, potentially making it the first US Ethereum ETF offering staking rewards. NASDAQ has also proposed a rule change to allow staking, signaling a serious move toward launching the first US spot Ethereum ETF with staking rewards.
- The US House of Representatives passed the Digital Asset Market Structure Clarity Act (CLARITY Act), clarifying digital asset regulations and dividing oversight between the SEC and CFTC. Additionally, the GENIUS Act, the first federal crypto law, was passed with bipartisan support, setting national standards for stablecoin issuance.
Sponsored
The Crypto Market Reaches New Heights
The total crypto market cap has surged by $121 billion in the last 24 hours, currently standing at $3.87 trillion. This impressive rise marks an all-time high in the total value of all cryptocurrencies. The increase signals strong investor confidence and broader market optimism for the digital asset sector.
The approval of the CLARITY and GENIUS Act in the US House of Representatives has sparked the recent surge in market cap. With clearer regulations for digital assets and stablecoin issuance, this bullish sentiment is likely to push the total market cap beyond $3.90 trillion, potentially even reaching $4.00 trillion.
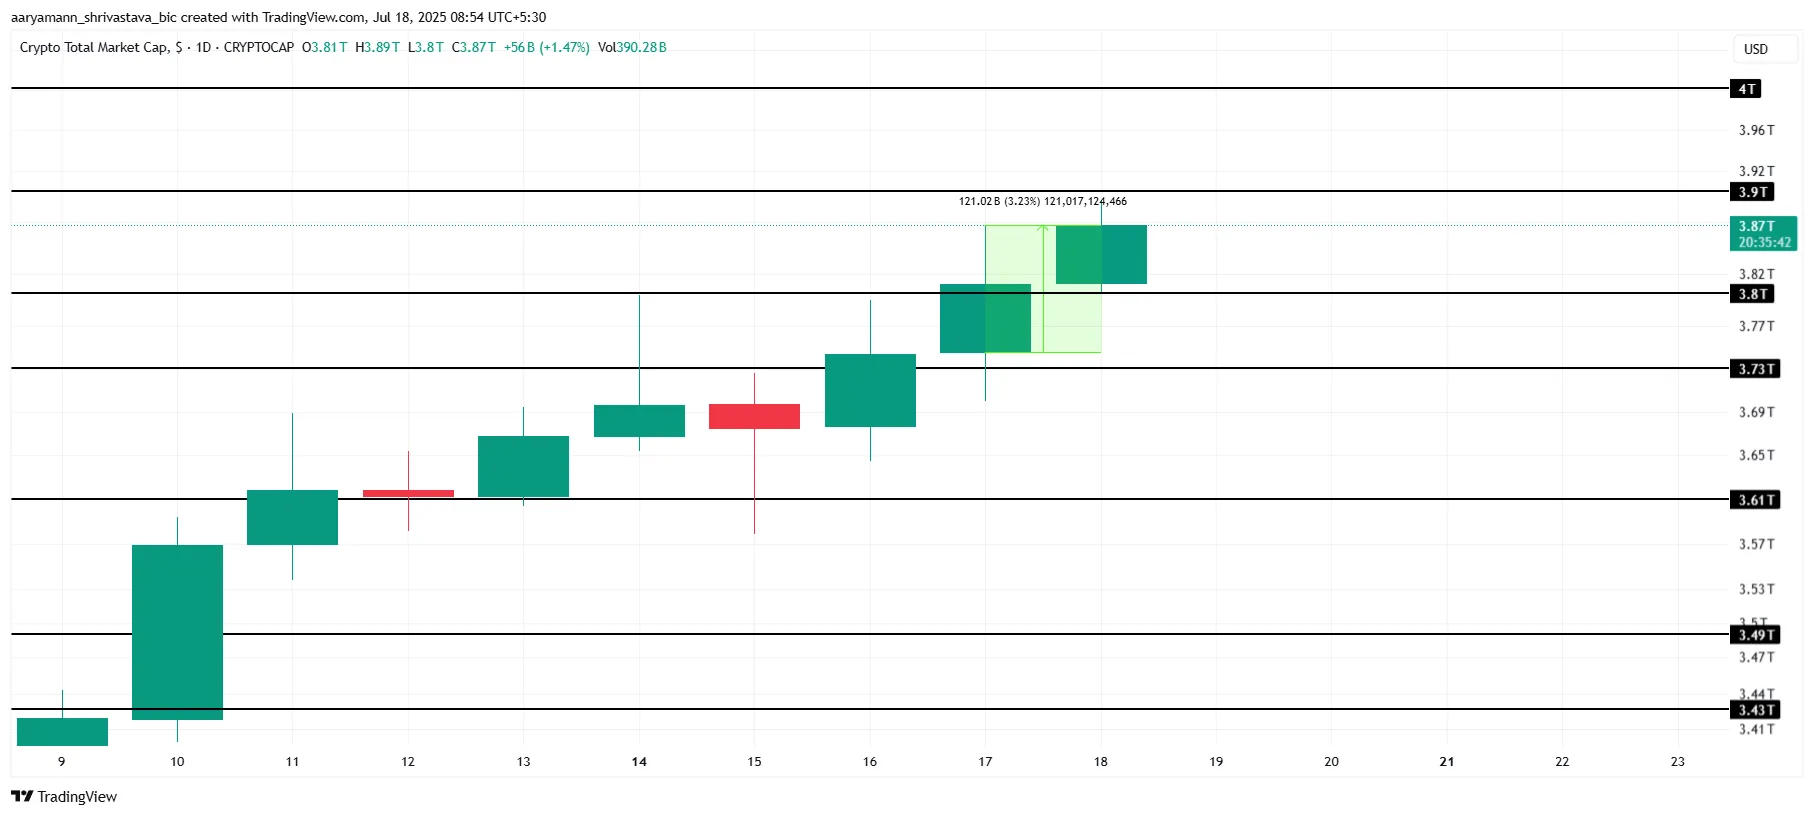
However, if the market experiences a pullback in the coming days, there is a possibility of a correction. In such a scenario, the market cap could dip to $3.80 trillion or even lower, with $3.73 trillion acting as a key support level to watch.
Bitcoin Reclaims Key Support
Bitcoin’s price is currently at $120,071, aiming to secure $120,000 as a key support level. This level is crucial for BTC as it looks to form a new all-time high (ATH). Stability at $120,000 could propel Bitcoin toward a potential ATH, bringing fresh momentum to the market.
The crypto king is just 2.6% away from breaching its ATH of $123,218. To achieve this, Bitcoin must first flip the $120,000 resistance into support. A successful move past $120,000 could fuel further upward movement, pushing Bitcoin closer to new price milestones and attracting more investors to the market.
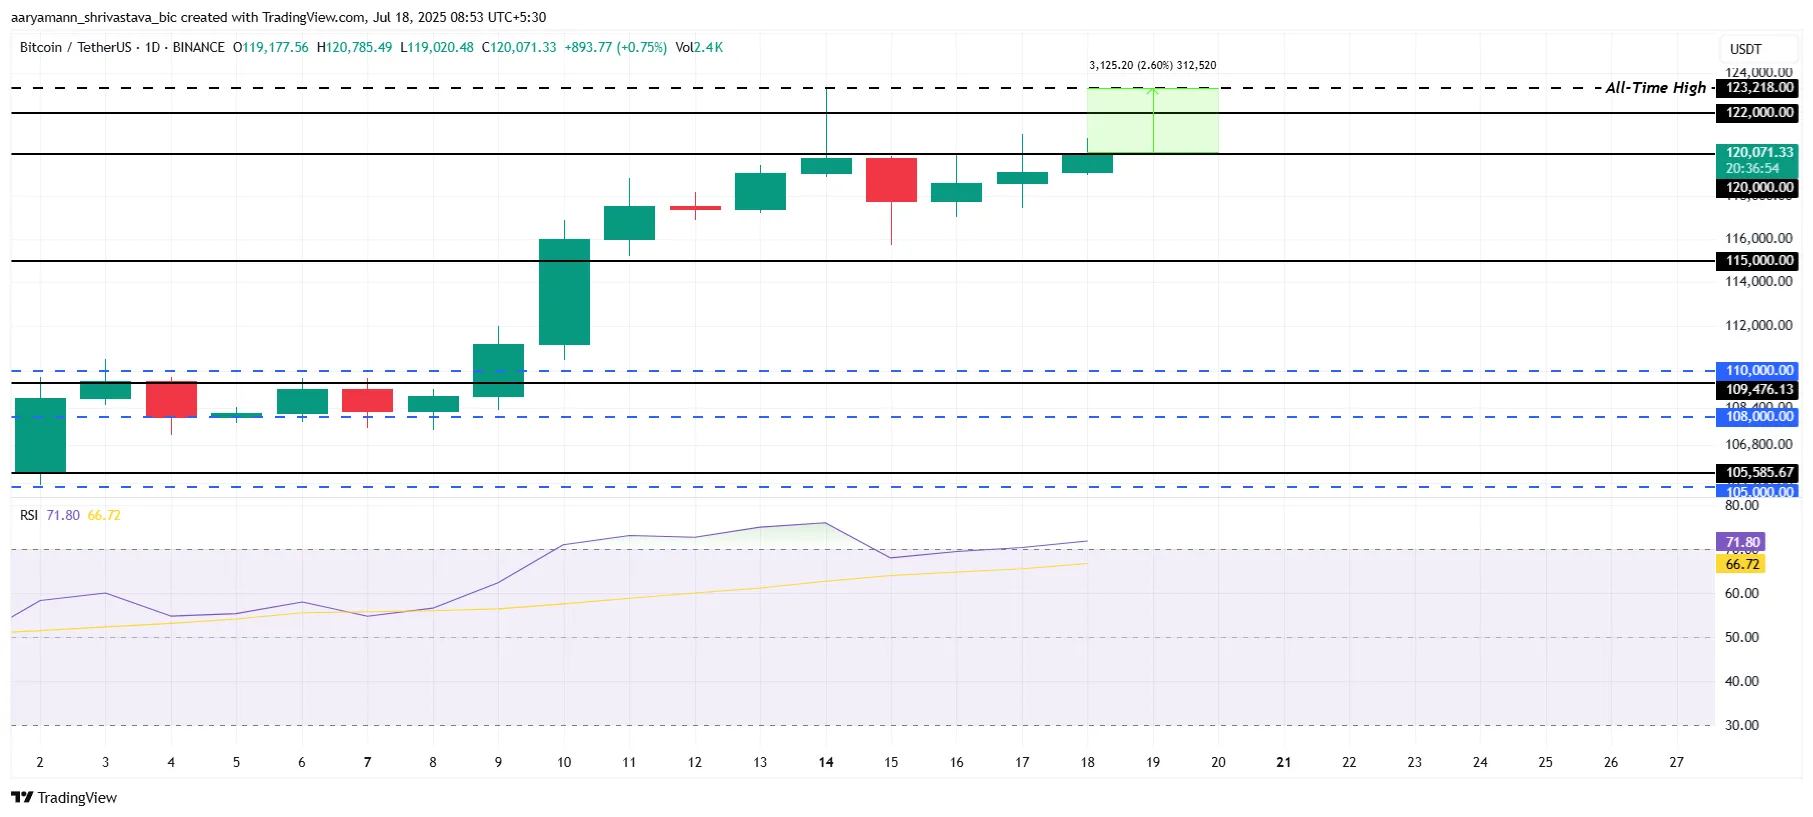
On the other hand, the RSI currently sits in the overbought zone, raising concerns. Historically, when an asset enters this zone, a reversal is likely. If Bitcoin faces a sell-off, the price could dip to $115,000, weakening its bullish outlook.
This potential downturn could challenge its path to a new ATH.
Sponsored
HBAR Is At A 5-Month High
HBAR price has surged 20.8% over the last 24 hours, trading at $0.285, marking a 5-month high. The altcoin is pushing towards the resistance level of $0.314, as market sentiment strengthens. This upward momentum could lead to further gains, with HBAR attempting to breach the resistance in the near term.
The rise in HBAR’s price has triggered a Golden Cross, with the 50-day EMA crossing above the 200-day EMA. This technical indicator signals a potential continuation of the uptrend, which could help HBAR break through the $0.314 resistance. If this momentum holds, the altcoin could secure further gains in the coming days.
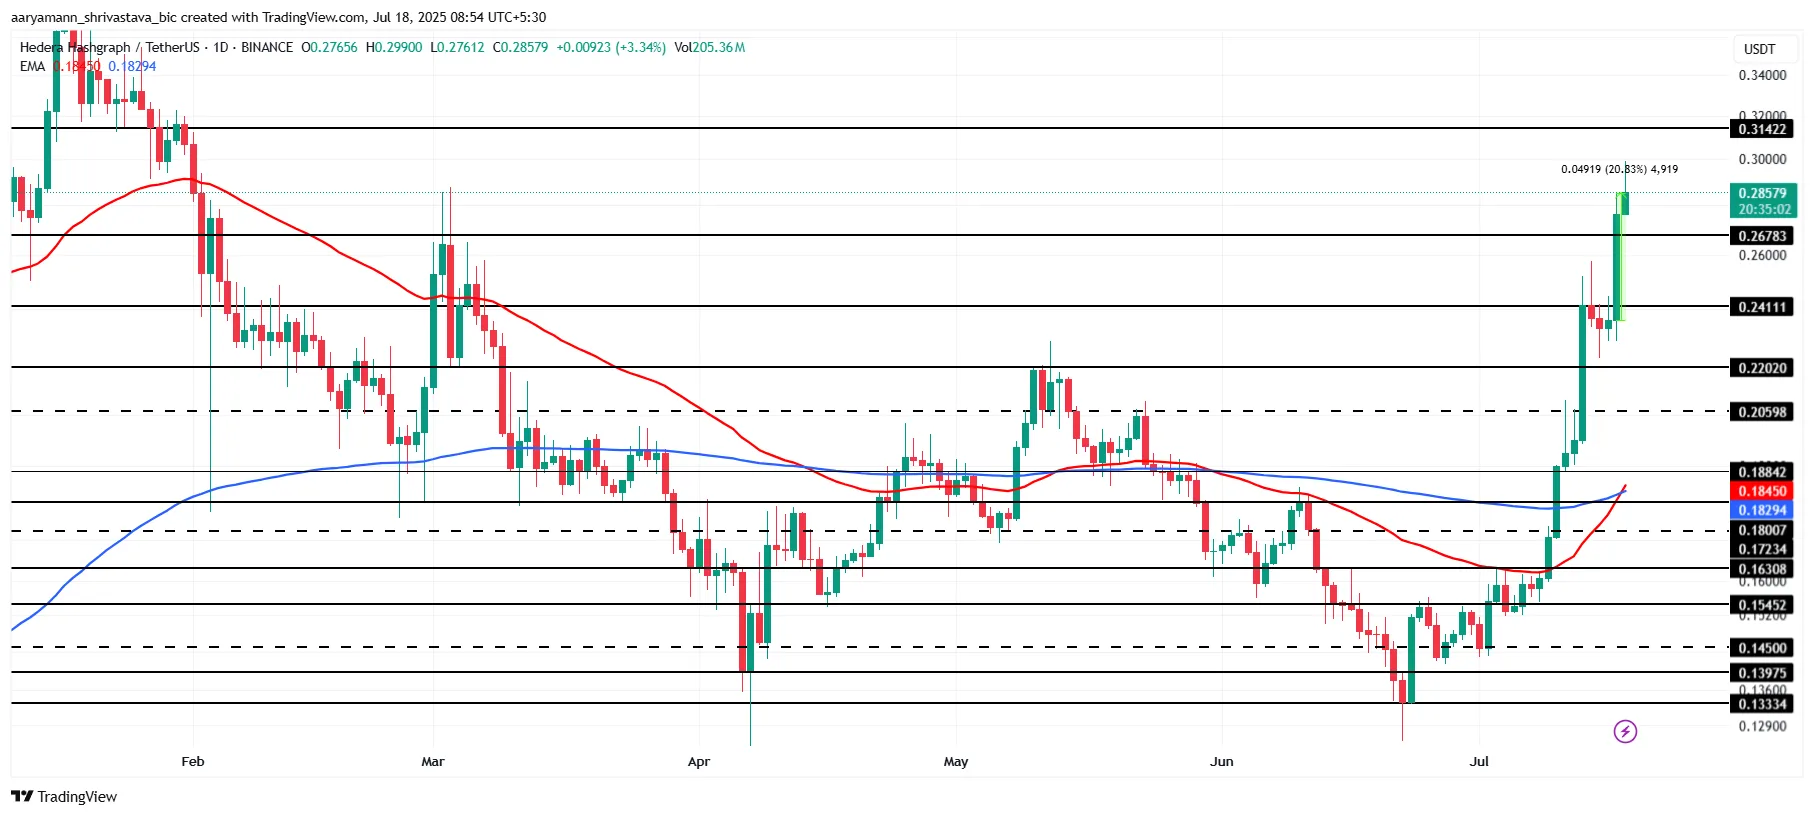
However, if HBAR investors turn bearish and begin selling, the price could fall below the $0.267 support. This would lead to a potential drop to $0.241, invalidating the bullish outlook. Market participants should closely monitor these key support levels for signs of a reversal.
source : https://beincrypto.com