


Pi Coin is steady around $0.47 after the “Buy Pi” fiat on‑ramp announcement kicked price up to $0.52; the first real push in days.
Two technical signals on the lower timeframe hint this may not be a one-off bounce: trend strength is back, and a second moving‑average trigger is close.
Trend Strength Returns, But Needs Confirmation
The Average Directional Index (ADX) on the 4‑hour chart is back above 30. That tells us the price move has strength behind it, not just random sentiment.
Sponsored
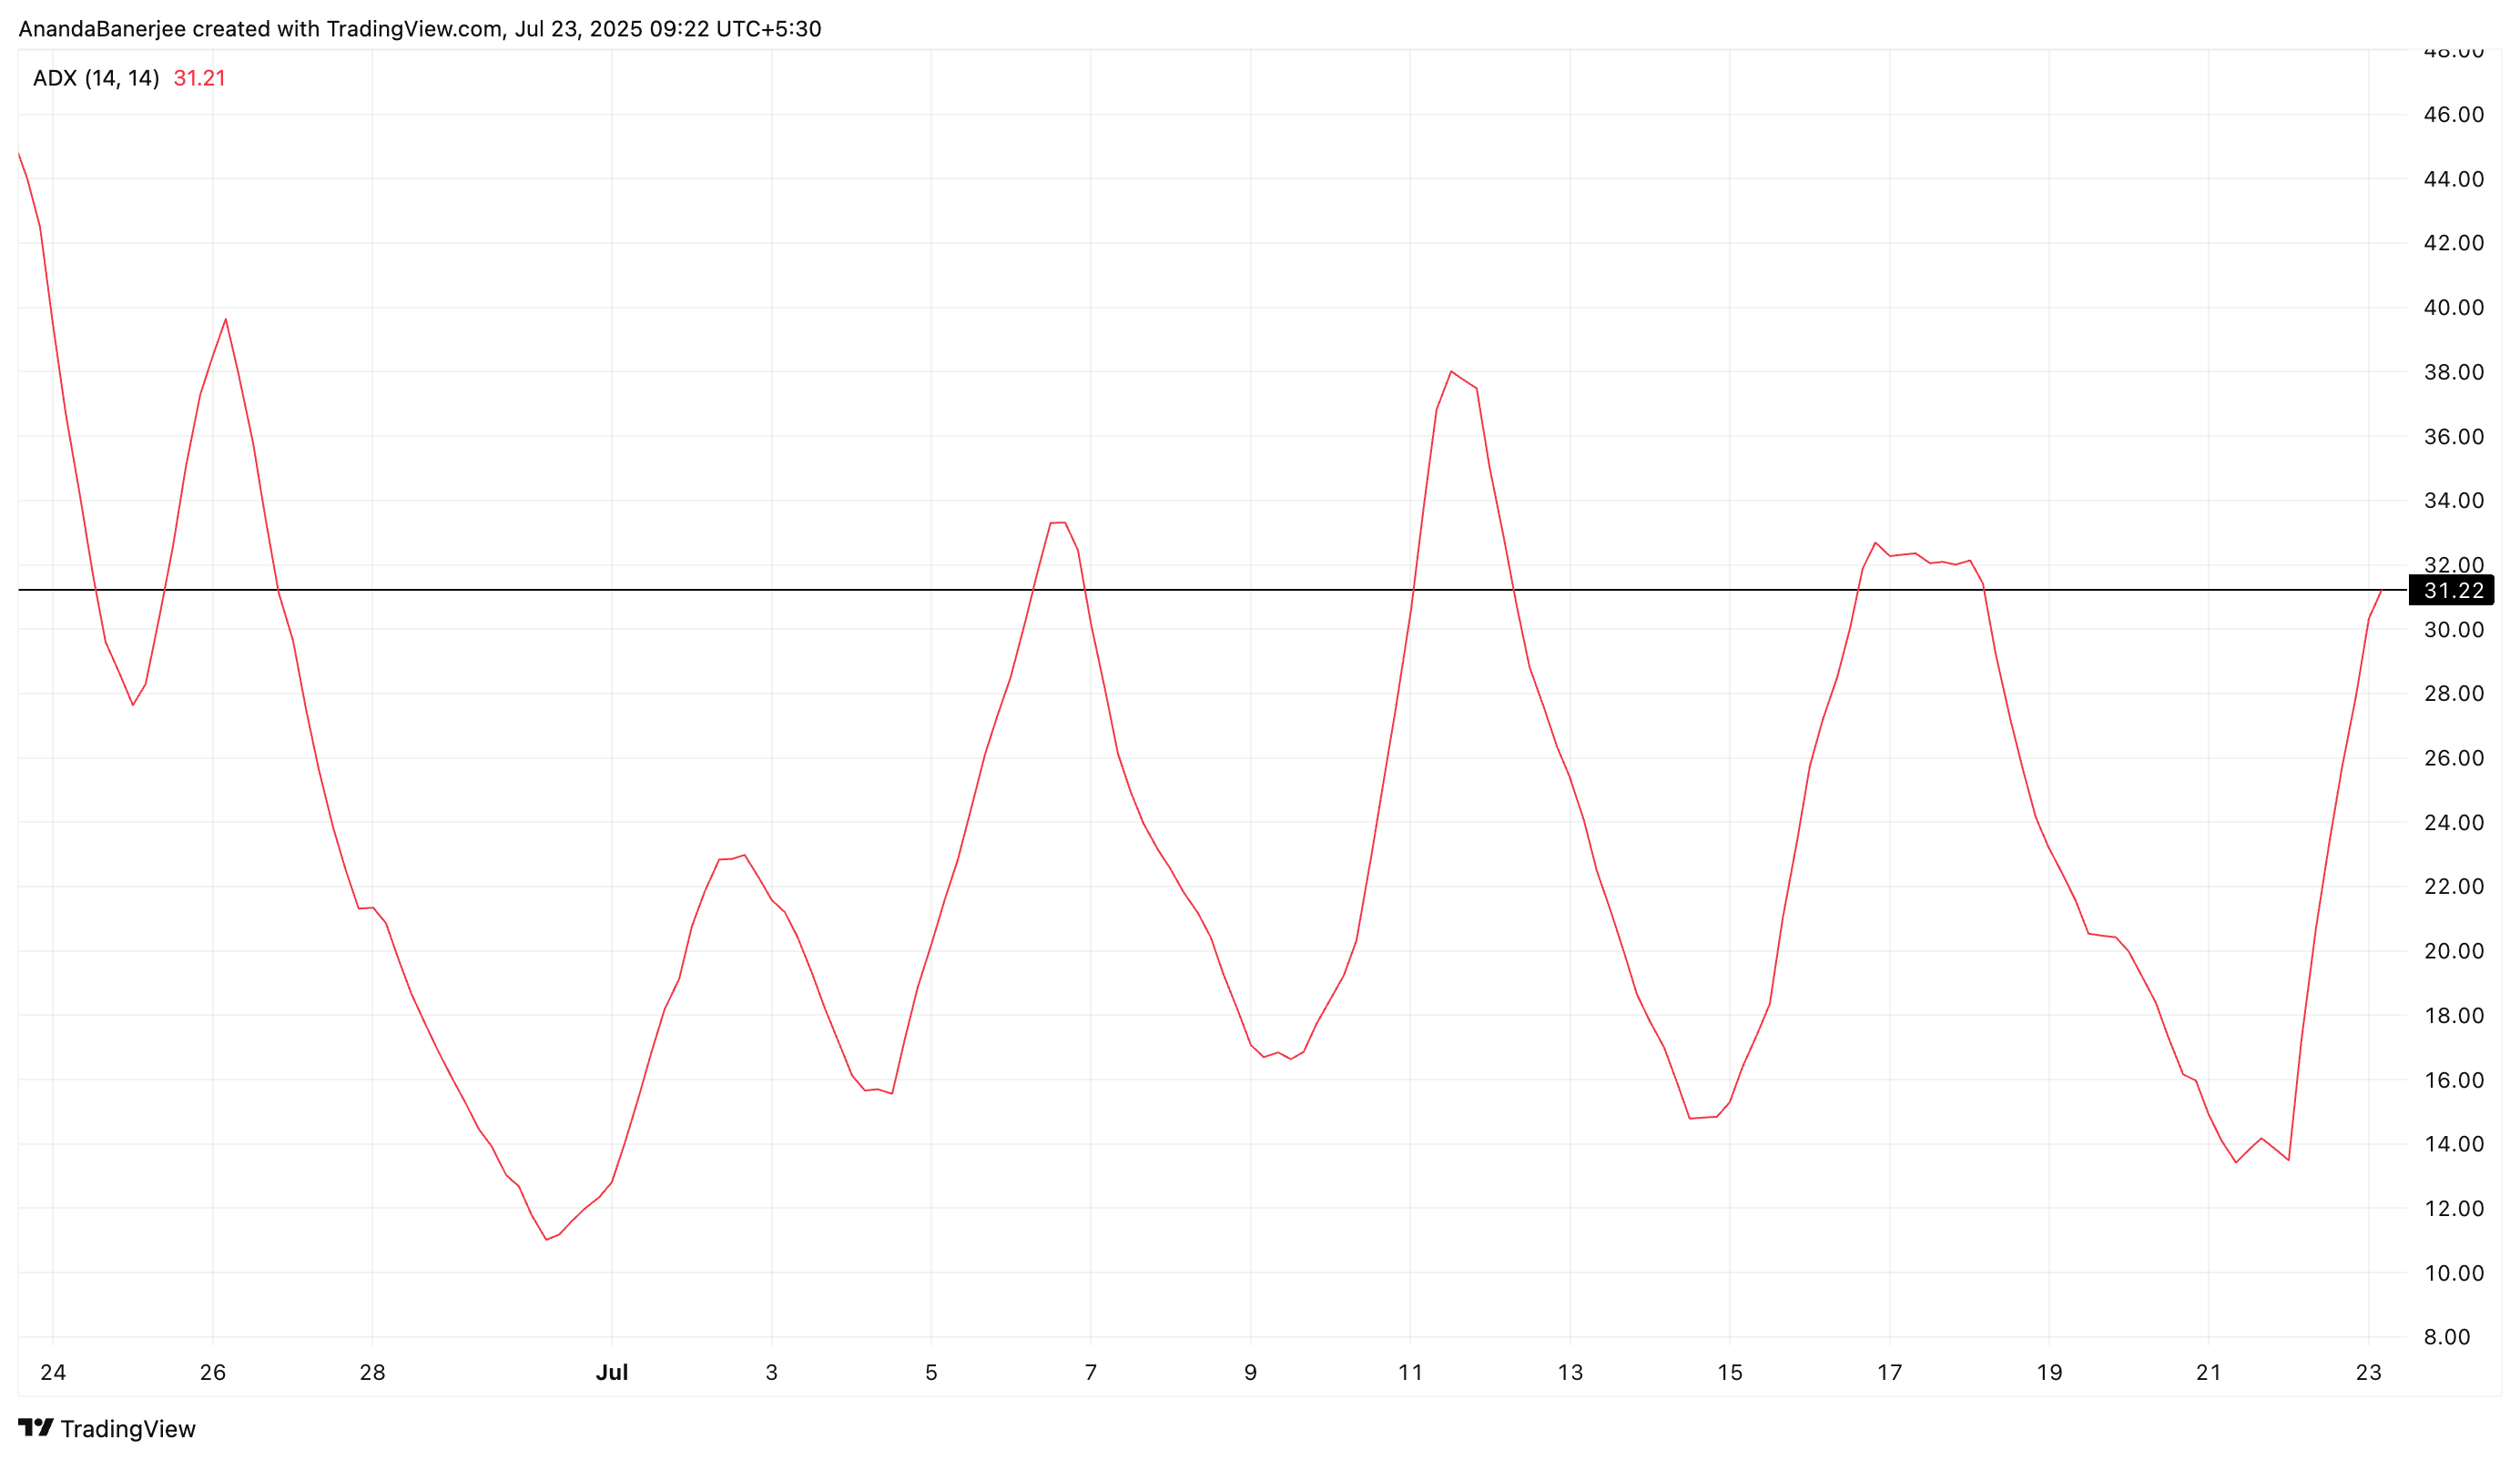
However, the current ADX peak is lower than the last one.
In plain terms, the Pi Coin price trend is there, but it is not yet stronger than the previous swing. A new ADX high, or simply keeping ADX above the mid‑20s, would firm up confidence.
The 4‑hour view is prioritized here because Tuesday’s jump happened inside the day; signals show up there first before the daily chart reacts.
ADX measures how strong a trend is (0 to 100). It does not say up or down, so it must be read with price action.
Want more token insights like this? Sign up for Editor Harsh Notariya’s Daily Crypto Newsletter here.
Sponsored
One EMA Trigger Still Pending
The fast (20-period) Exponential Moving Average (EMA) has already crossed above the medium (50-period) EMA, and that lined up with the move from $0.45 to $0.52.
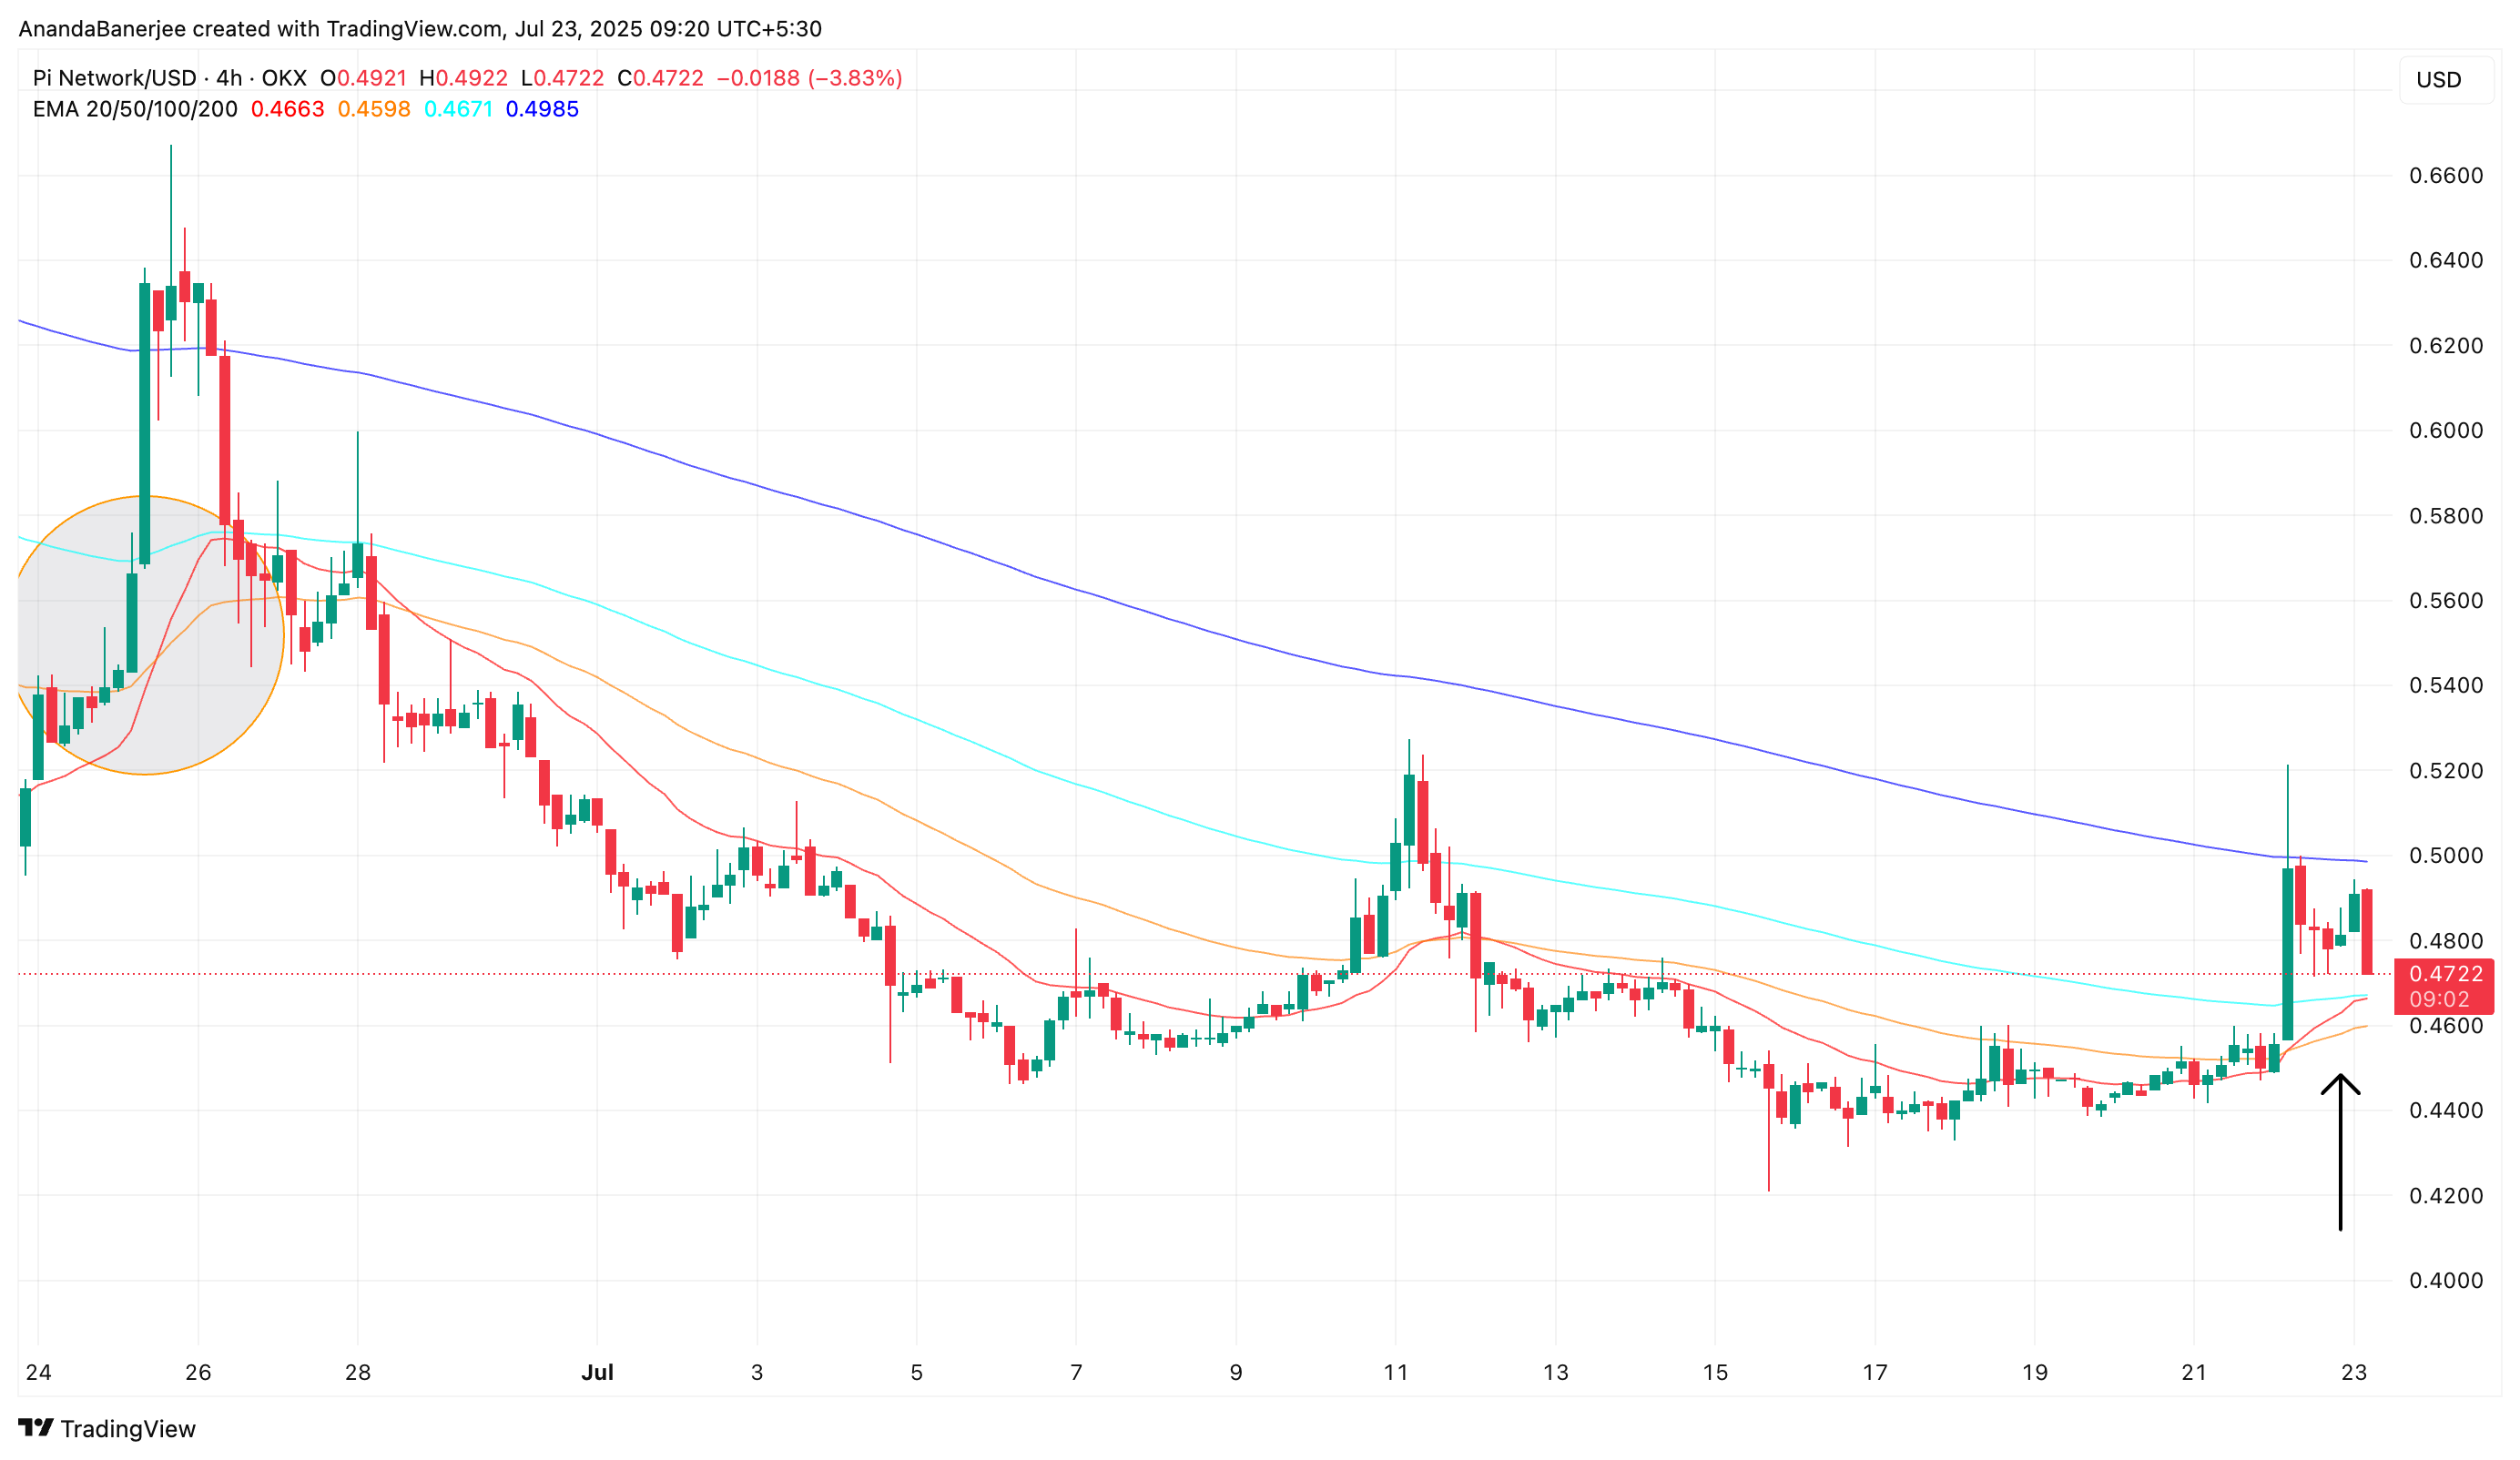
The same thing happened in late June when the price ran from about $0.56 to $0.66. Back then, the fast EMA failed to clear the next slower (100-period) EMA, and the Pi Coin rally faded. That second cross is now getting close again, almost waiting to happen.
If it happens this time while ADX stays firm, the odds of a bigger PI price rally improve.
The 200‑period EMA (blue line) on the 4‑hour chart was briefly crossed by the price yesterday, before experiencing resistance. A clean close above it would match the price structure with momentum.
EMAs weigh recent prices more than older ones, so when the shorter lines climb over the longer ones, it signals rising speed in the move.
Key Pi Coin Price Levels to Watch
The daily chart sets the main levels for the bigger picture. A trend‑based Fibonacci extension is used here. It links three points: the late‑June low at $0.47, the swing high near $0.66, and the mid‑July pullback to $0.42.
Sponsored
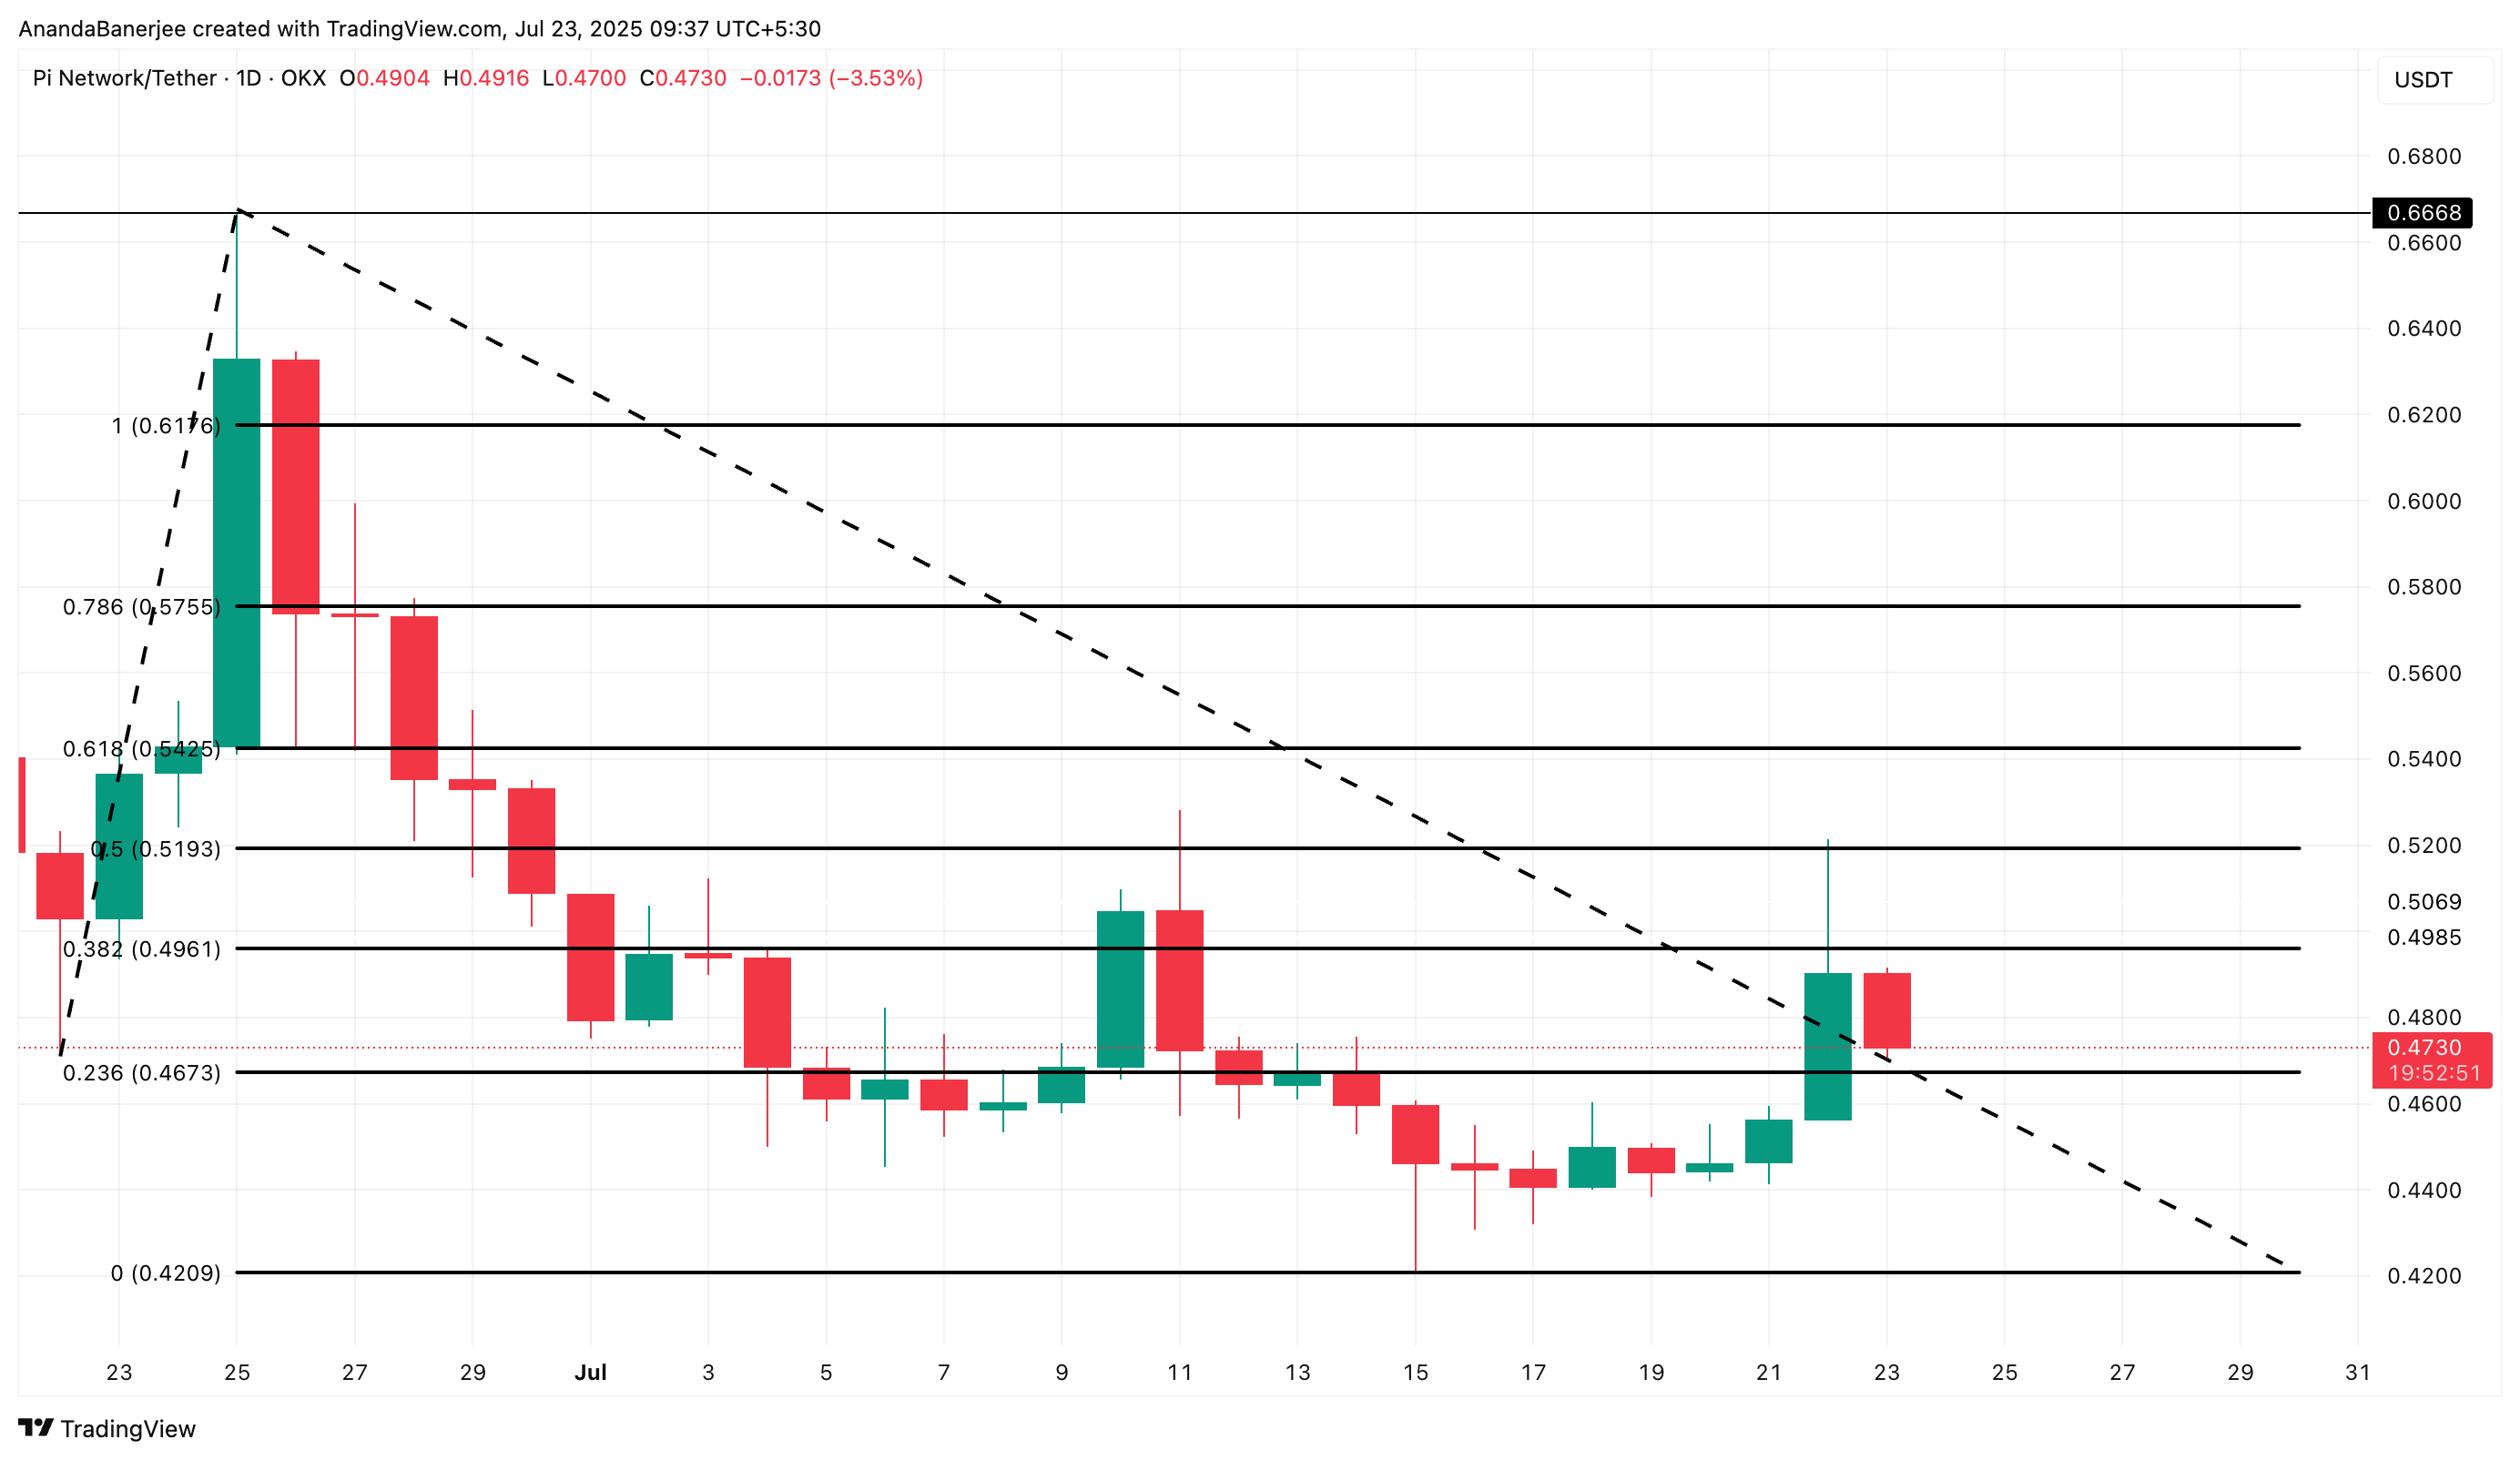
Tuesday’s candle pushed through three Fibonacci bands in one day: 0.236 at $0.46, 0.382 at $0.49, and 0.5 at $0.51. PI Price is now pausing in the $0.46–$0.49 range.
A daily close above that range opens $0.54 first (0.618) and then $0.66, the prior swing high, roughly 40% above current levels if momentum carries on and the much-awaited EMA cross finally happens.
Sponsored
An inverted bullish hammer formed on the rebound (Tuesday candle), showing buyers stepped in near the lows.
Invalidation is clear: a close back under $0.46, ADX dropping under the mid‑20s, and the 20-period EMA failing to clear the 100-period line would likely send Pi Coin’s price back toward $0.42.
source : https://beincrypto.com