


HBAR price is in the middle of a strong uptrend, trading at $0.27 after a stellar seven-day rally. With bullish momentum, the altcoin is inching closer to the $0.30 mark, a level not seen in five months.
However, while prices rise, historical indicators suggest a pullback may be imminent. Traders and investors should tread carefully as potential losses are surfacing across technical charts.
HBAR Traders Could Be In Trouble
Sponsored
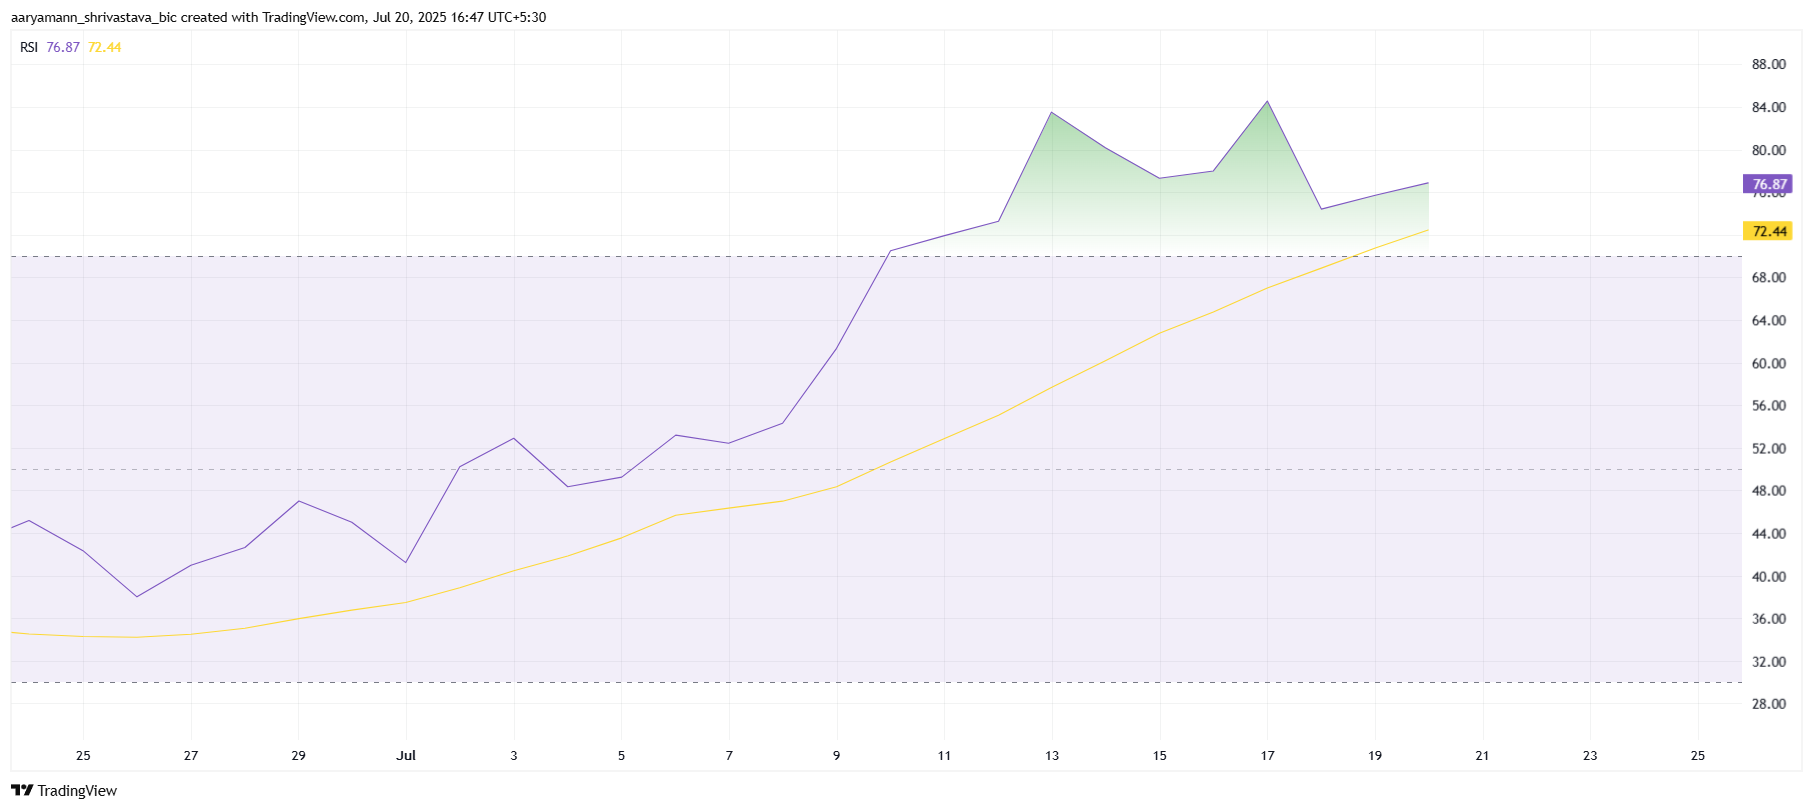
The Relative Strength Index (RSI) for HBAR has been sitting above 70.0 for the past week, signaling overbought conditions. Historically, when assets enter this zone, a price cooldown tends to follow.
The rally so far has been backed by positive sentiment in the broader crypto market, but HBAR may soon feel the pressure of profit-taking.
While the momentum is positive, indicators are flashing caution. Overbought zones often lead to corrections, especially when traders decide to secure gains. If history repeats itself, HBAR may follow the same pattern and experience a short-term decline, affecting its upward trajectory.
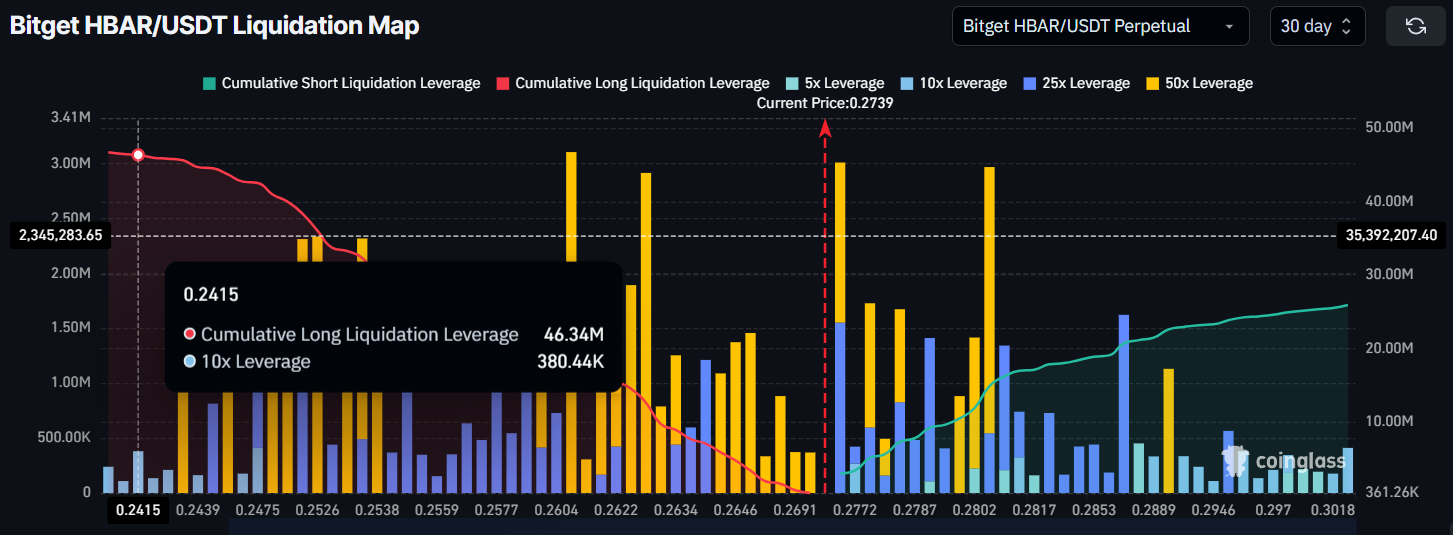
Zooming out, the broader momentum presents another concern. Liquidation maps show a cluster of potential long liquidations just below the current price range.
If HBAR drops to $0.24, the data suggests it could trigger up to $46 million in long liquidations. This would likely lead to an acceleration of losses as leveraged traders exit their positions.
Such a cascade could create selling pressure that outweighs bullish sentiment, making recovery more difficult. If this scenario plays out, market confidence could be shaken, with many retail investors pulling back. This macro setup warrants caution despite the current price strength.
Can HBAR Price Rise Continue?
Sponsored
HBAR is currently attempting to confirm $0.26 as a solid support level. If successful, this would give the altcoin the foundation to climb further. A stable hold above this mark could push HBAR toward the psychological $0.30 mark, extending its five-month high streak.
However, should overbought risk materialize, the altcoin could fall to $0.24, triggering a liquidation event. This could send HBAR tumbling to $0.22, wiping out recent gains and shaking short-term confidence in the rally.
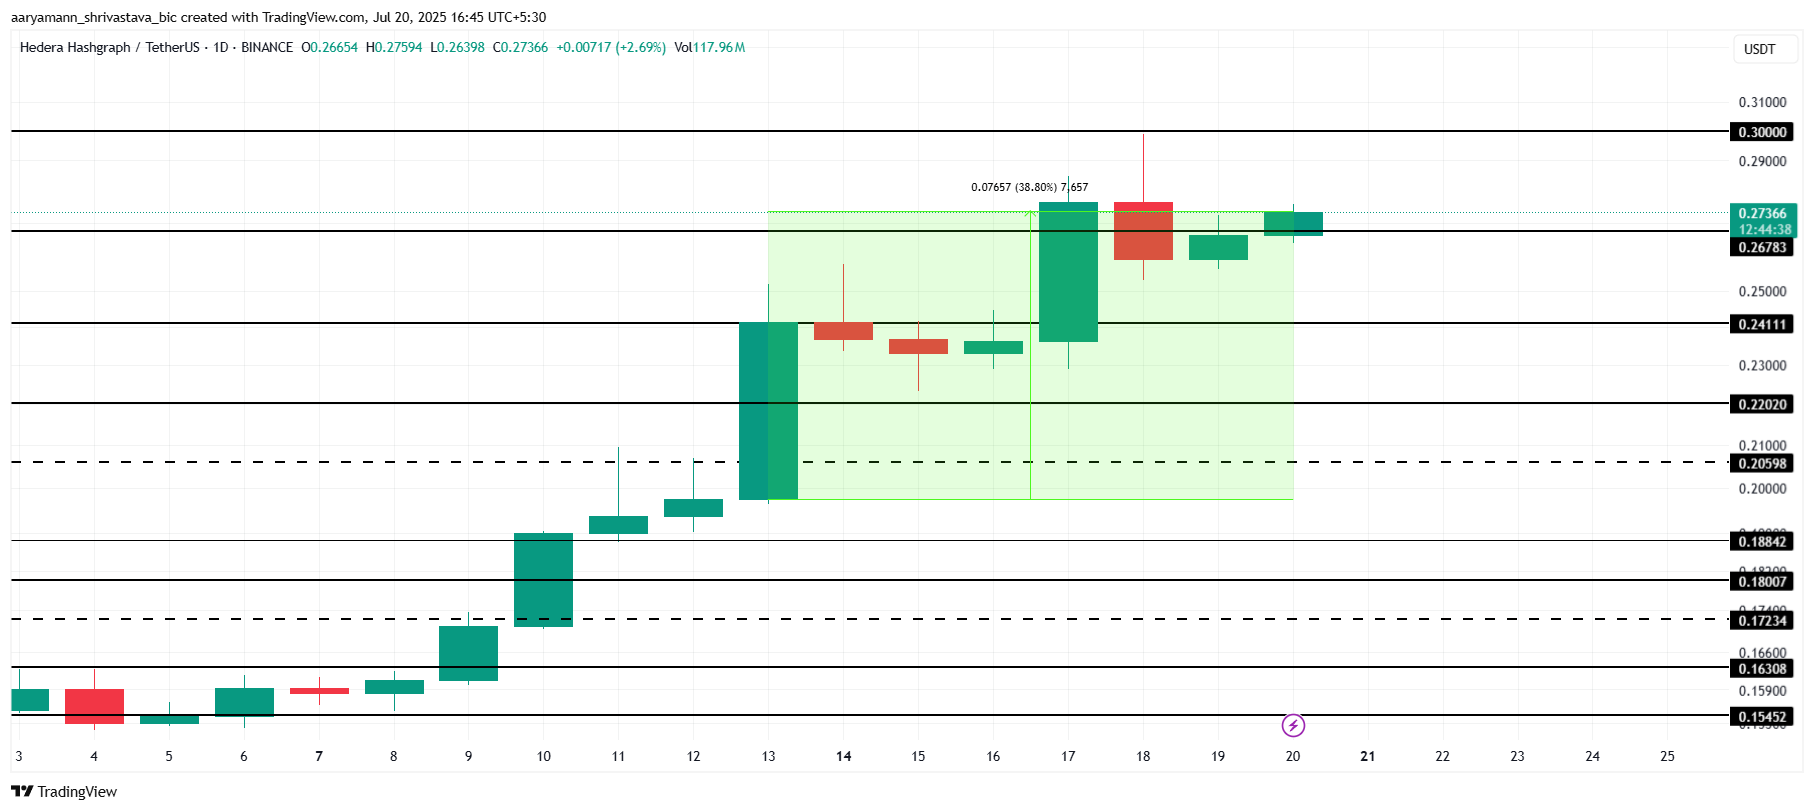
Alternatively, if bullish cues from the broader market persist, HBAR may bounce off $0.26 and reclaim the $0.30 level. This would invalidate the bearish outlook and continue rising on the daily chart.
source : https://beincrypto.com