


Stellar (XLM) has seen a recent surge in its price, driven by the broader market’s bullish sentiment. This uptick has sparked a positive momentum, which is currently visible in technical indicators.
XLM’s price is showing signs of further strengthening, and investors are looking to see if the altcoin will continue its upward trend.
Stellar Has Potential To Continue Recovery
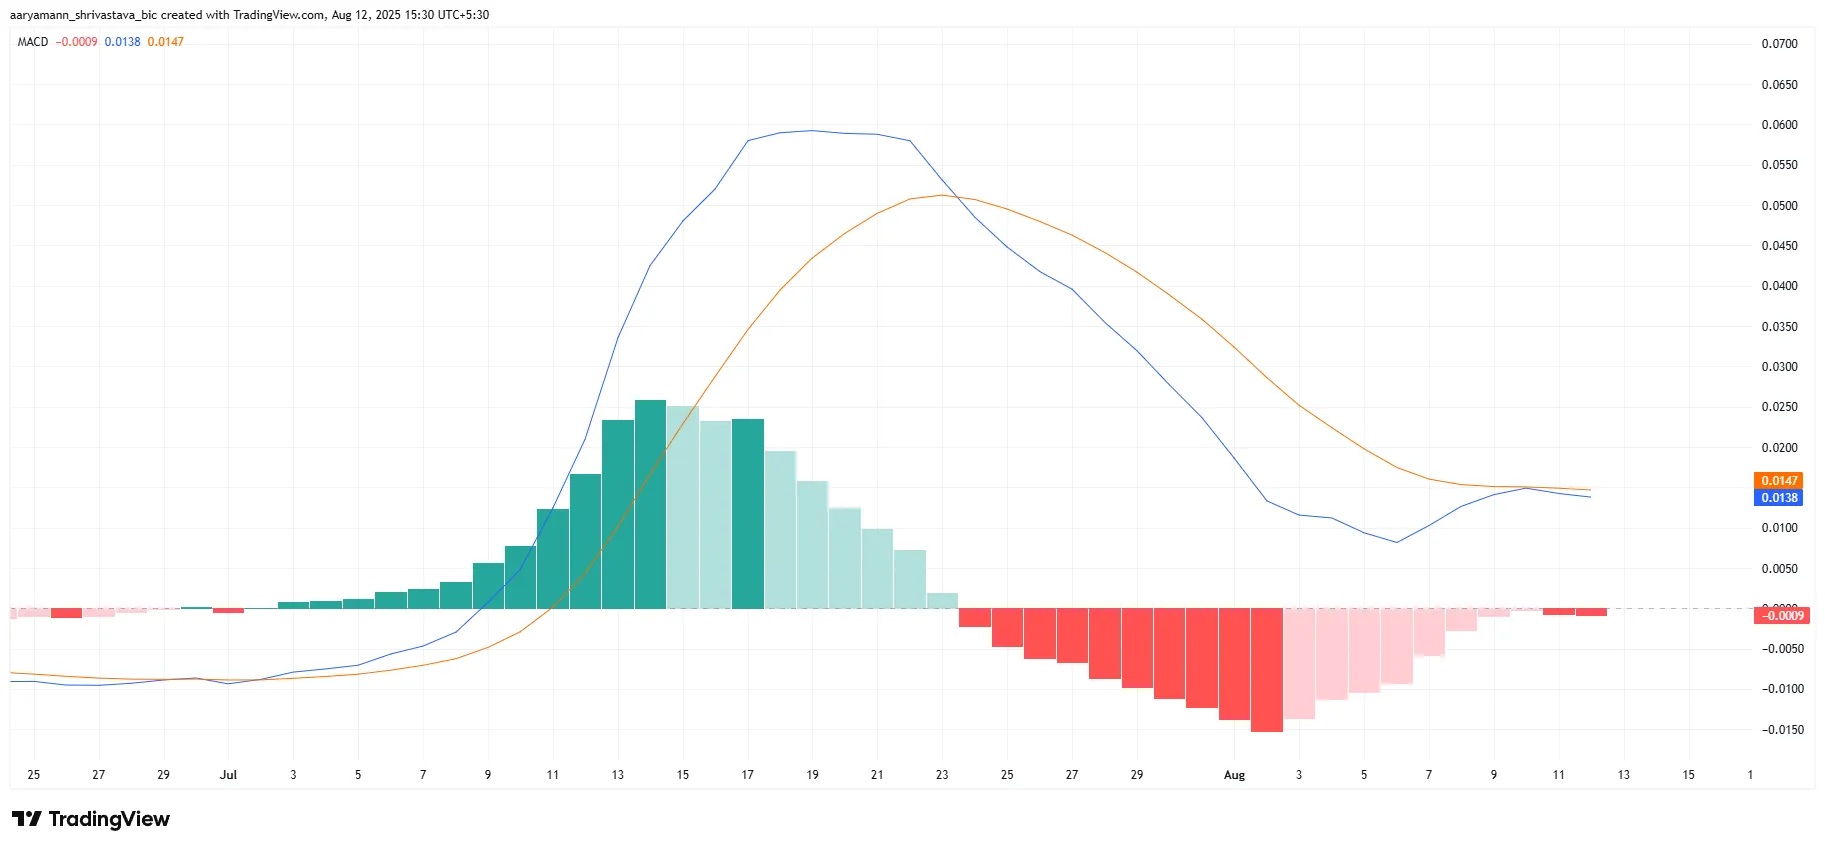
The Moving Average Convergence Divergence (MACD) indicator is showing signs of a potential bullish crossover for XLM. The MACD histogram almost flipped to bullish in recent days but faced a slight hiccup. However, this setback is likely to be short-lived as the broader market conditions improve.
With the broader market showing signs of stability, the bullish crossover on the MACD could push XLM past its current resistance levels. This would open the door for further price appreciation, as more investors enter the market, buoyed by the positive momentum.
Sponsored
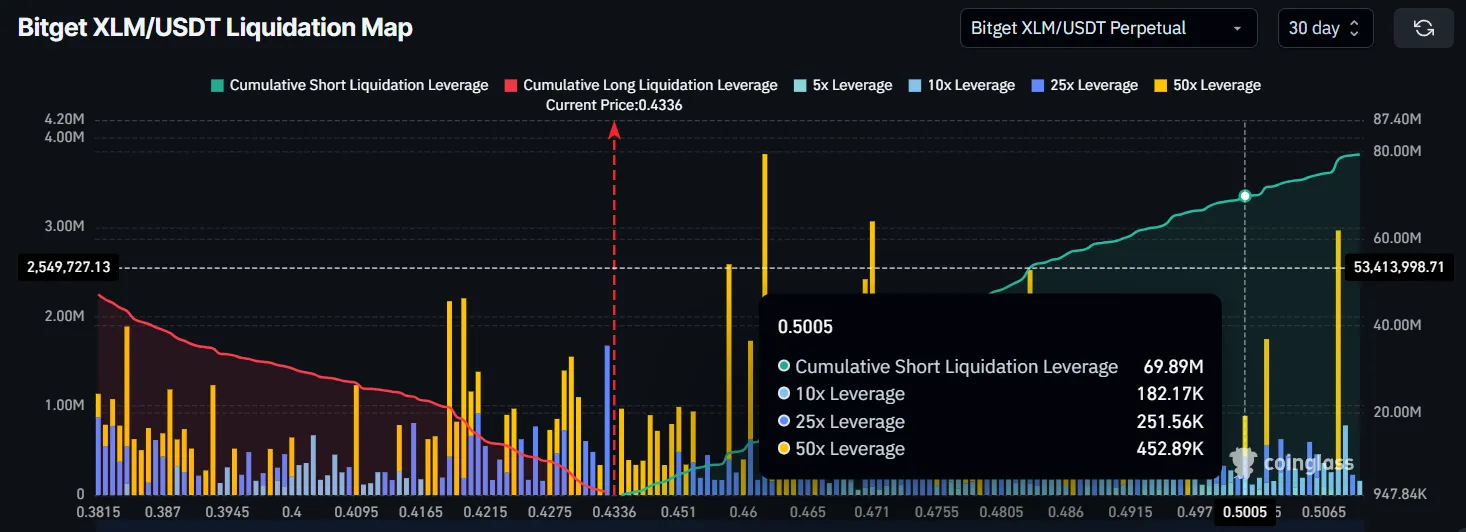
The broader recovery for XLM is also supported by the liquidation map, which indicates that a significant number of bearish traders are holding short positions. If XLM continues its upward trajectory, it could trigger liquidations worth nearly $70 million in short contracts. This liquidation would further fuel the bullish momentum, making it difficult for bears to control the market.
XLM’s complete recovery is likely to occur at the $0.50 level, where the altcoin will likely consolidate and face new resistance. Reaching this level would create a ripple effect, forcing bearish traders to cover their positions.
XLM Price Needs A Push
Currently, XLM is trading at $0.434, having risen 18% in the last ten days. The altcoin is facing resistance at $0.445. In order to complete its recovery, XLM needs to break past this resistance and reach the $0.500 level. If the price continues to move in this direction, a sustained rally may be in the cards.
The bullish momentum could propel XLM to $0.470, pushing it closer to the $0.500 target. As the short liquidations mount, bearish pressure will fade, giving room for continued bullishness. This scenario would likely lead XLM to new highs, with a potential breakout above $0.500.
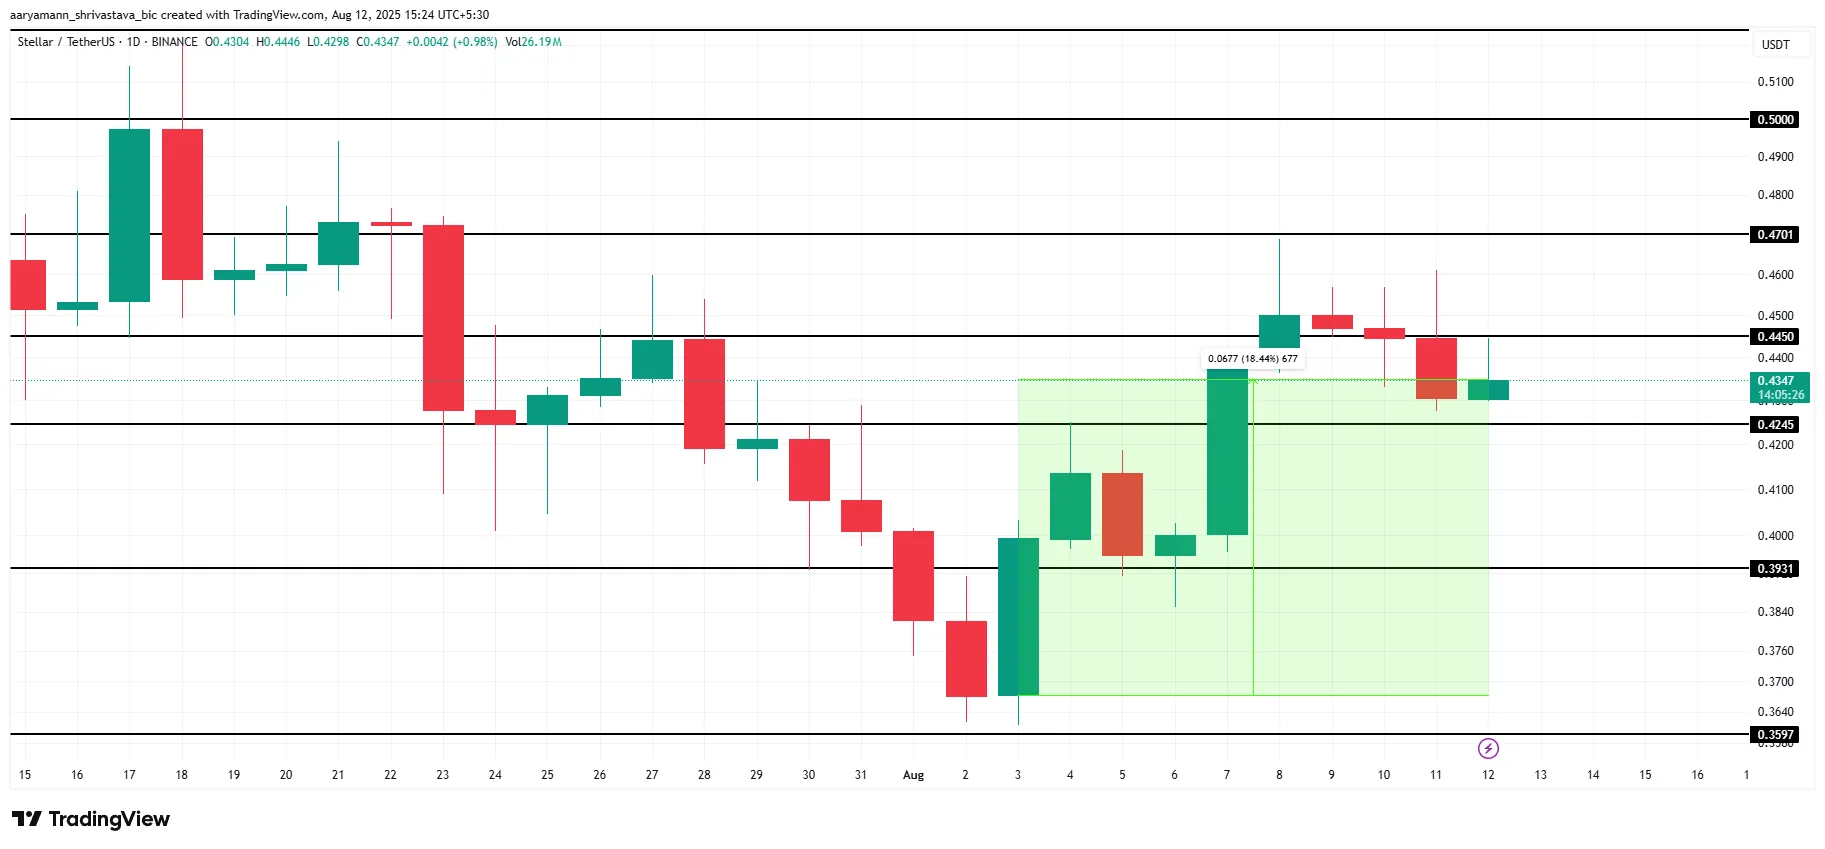
However, if XLM faces selling pressure, it could fall below the $0.424 support level. A drop to $0.393 would invalidate the current bullish thesis, signaling a shift in sentiment. Such a pullback would raise concerns about the sustainability of the current trend, potentially stalling XLM’s recovery for the time being.
source : https://beincrypto.com