


Popular altcoin Solana has seen a modest recovery, climbing upward since August 2. Despite earlier weakness, the token has since rallied nearly 10%, reaching $171.91 at press time.
The uptick suggests a potential shift in sentiment, with technical indicators hinting at a continuation of the uptrend.
SOL Price Recovery Gains Steam
Sponsored
Readings from the SOL/USD one-day chart show a gradual resurgence of bullish momentum among SOL holders.
For example, its Balance of Power (BoP) is positive as of this writing, indicating that bias is currently skewed in favor of the bulls. It is presently in an uptrend and stands at 0.76.
For token TA and market updates: Want more token insights like this? Sign up for Editor Harsh Notariya’s Daily Crypto Newsletter here.
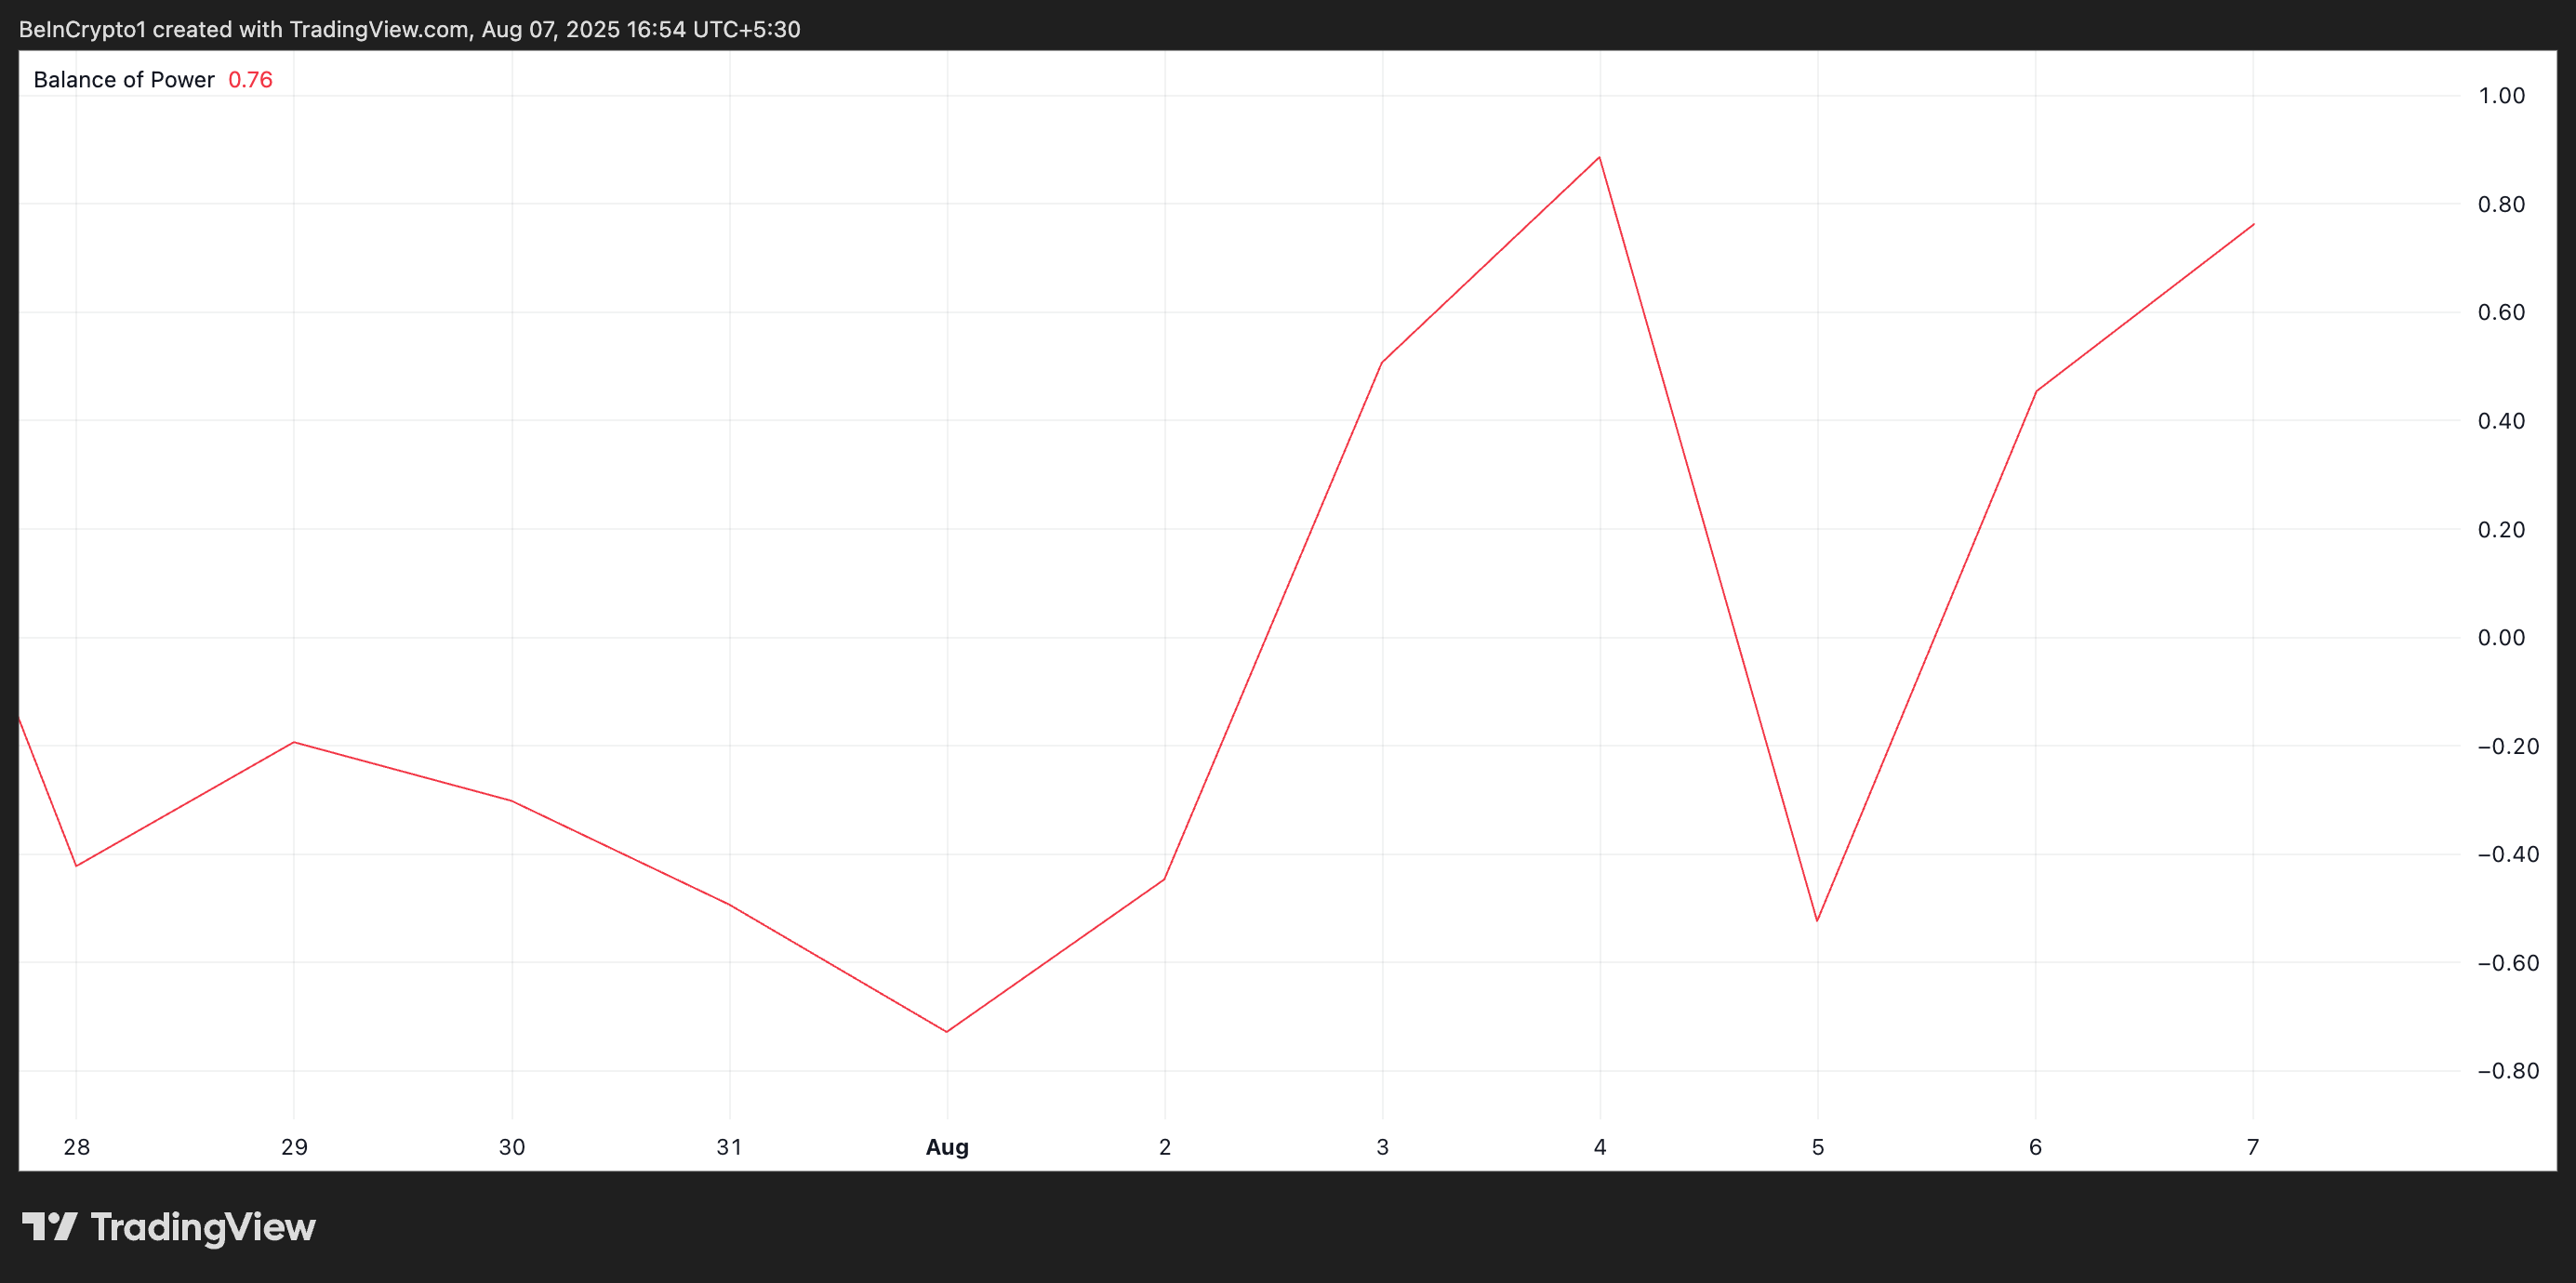
The BoP measures the strength of buyers versus sellers in the market. It compares the price movement within a trading period to determine which side has more control. BoP values typically oscillate between -1 and +1.
A positive BoP suggests that buyers are dominating, pushing prices higher by closing near the top of the range, while a negative BoP indicates that sellers have the upper hand, closing prices near the bottom of the range.
For SOL, its current positive BoP reading signals that bulls are gaining market control, strengthening the ongoing price recovery.
Furthermore, the climbing Relative Strength Index (RSI) adds to the bullish outlook for SOL. This key momentum indicator currently stands at 51.65, ticking up, indicating a steady rise in buy-side pressure.
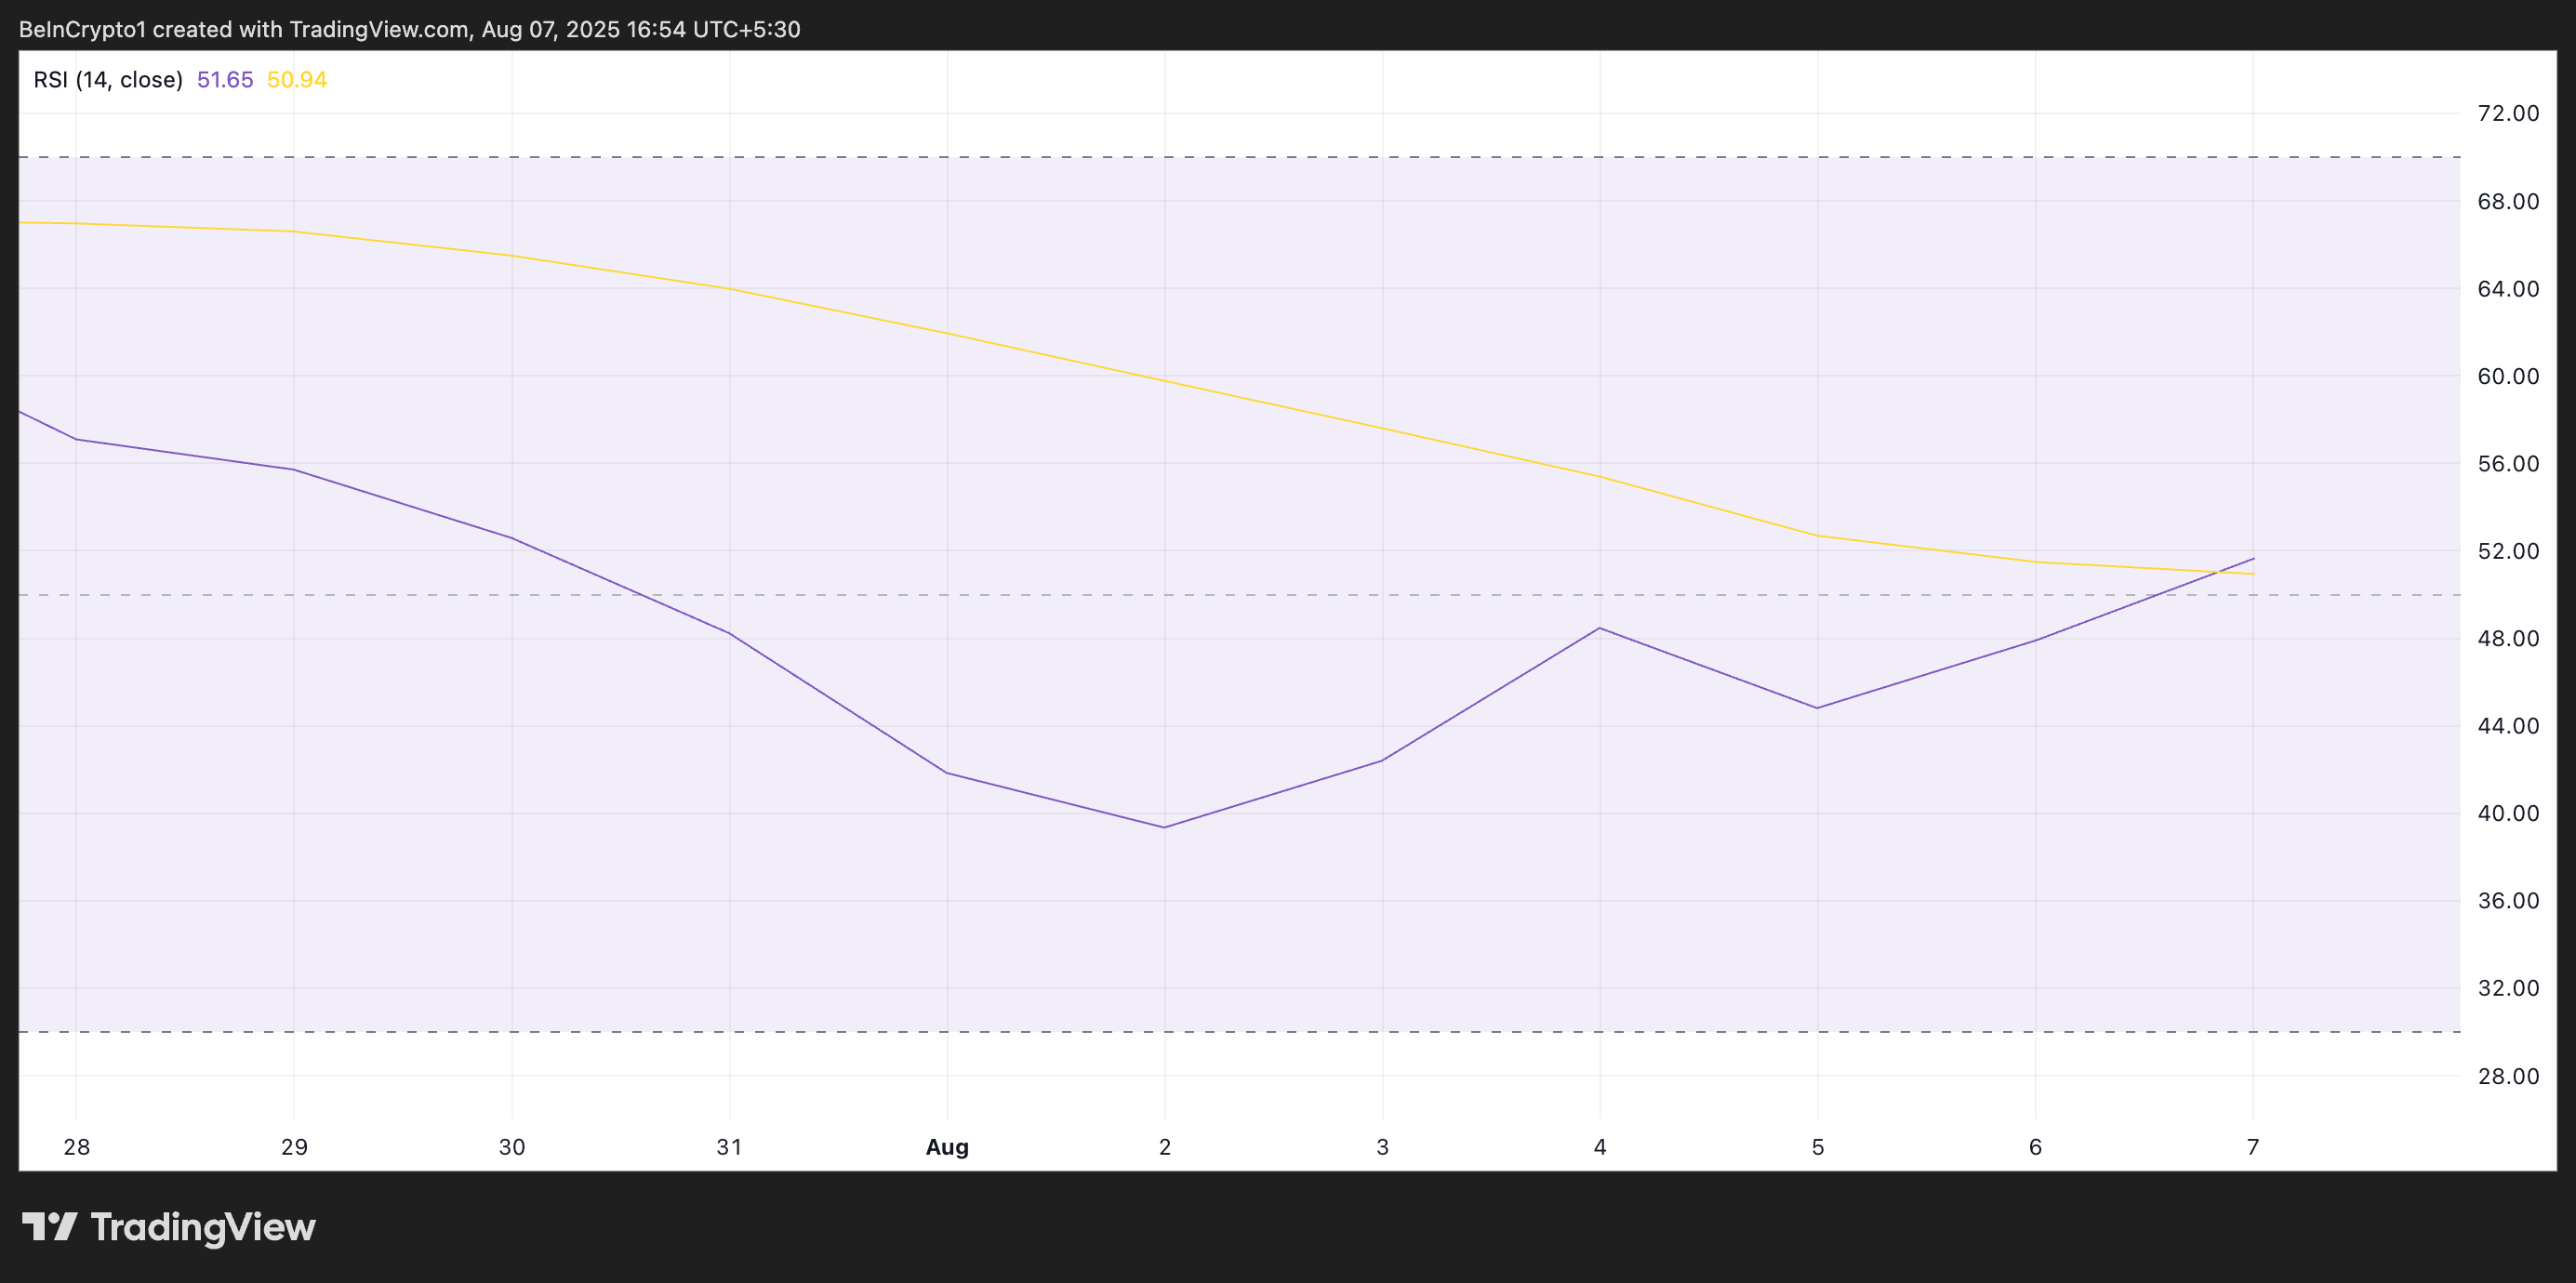
The RSI indicator measures an asset’s overbought and oversold market conditions. It ranges between 0 and 100. Values above 70 suggest that the asset is overbought and due for a price decline, while values under 30 indicate that the asset is oversold and may witness a rebound.
At 51.65 and climbing, SOL’s RSI suggests strengthening bullish momentum. Its buyers are gradually regaining control, leaving room for further upside if demand continues to build.
SOL Price Approaches Make-or-Break Moment
Sponsored
A sustained wave of buying pressure could fuel a breakout above SOL’s immediate resistance at $176.33.
If this level is cleared with strong momentum, SOL may be poised to push past the psychological barrier at $180, opening the door to further gains.
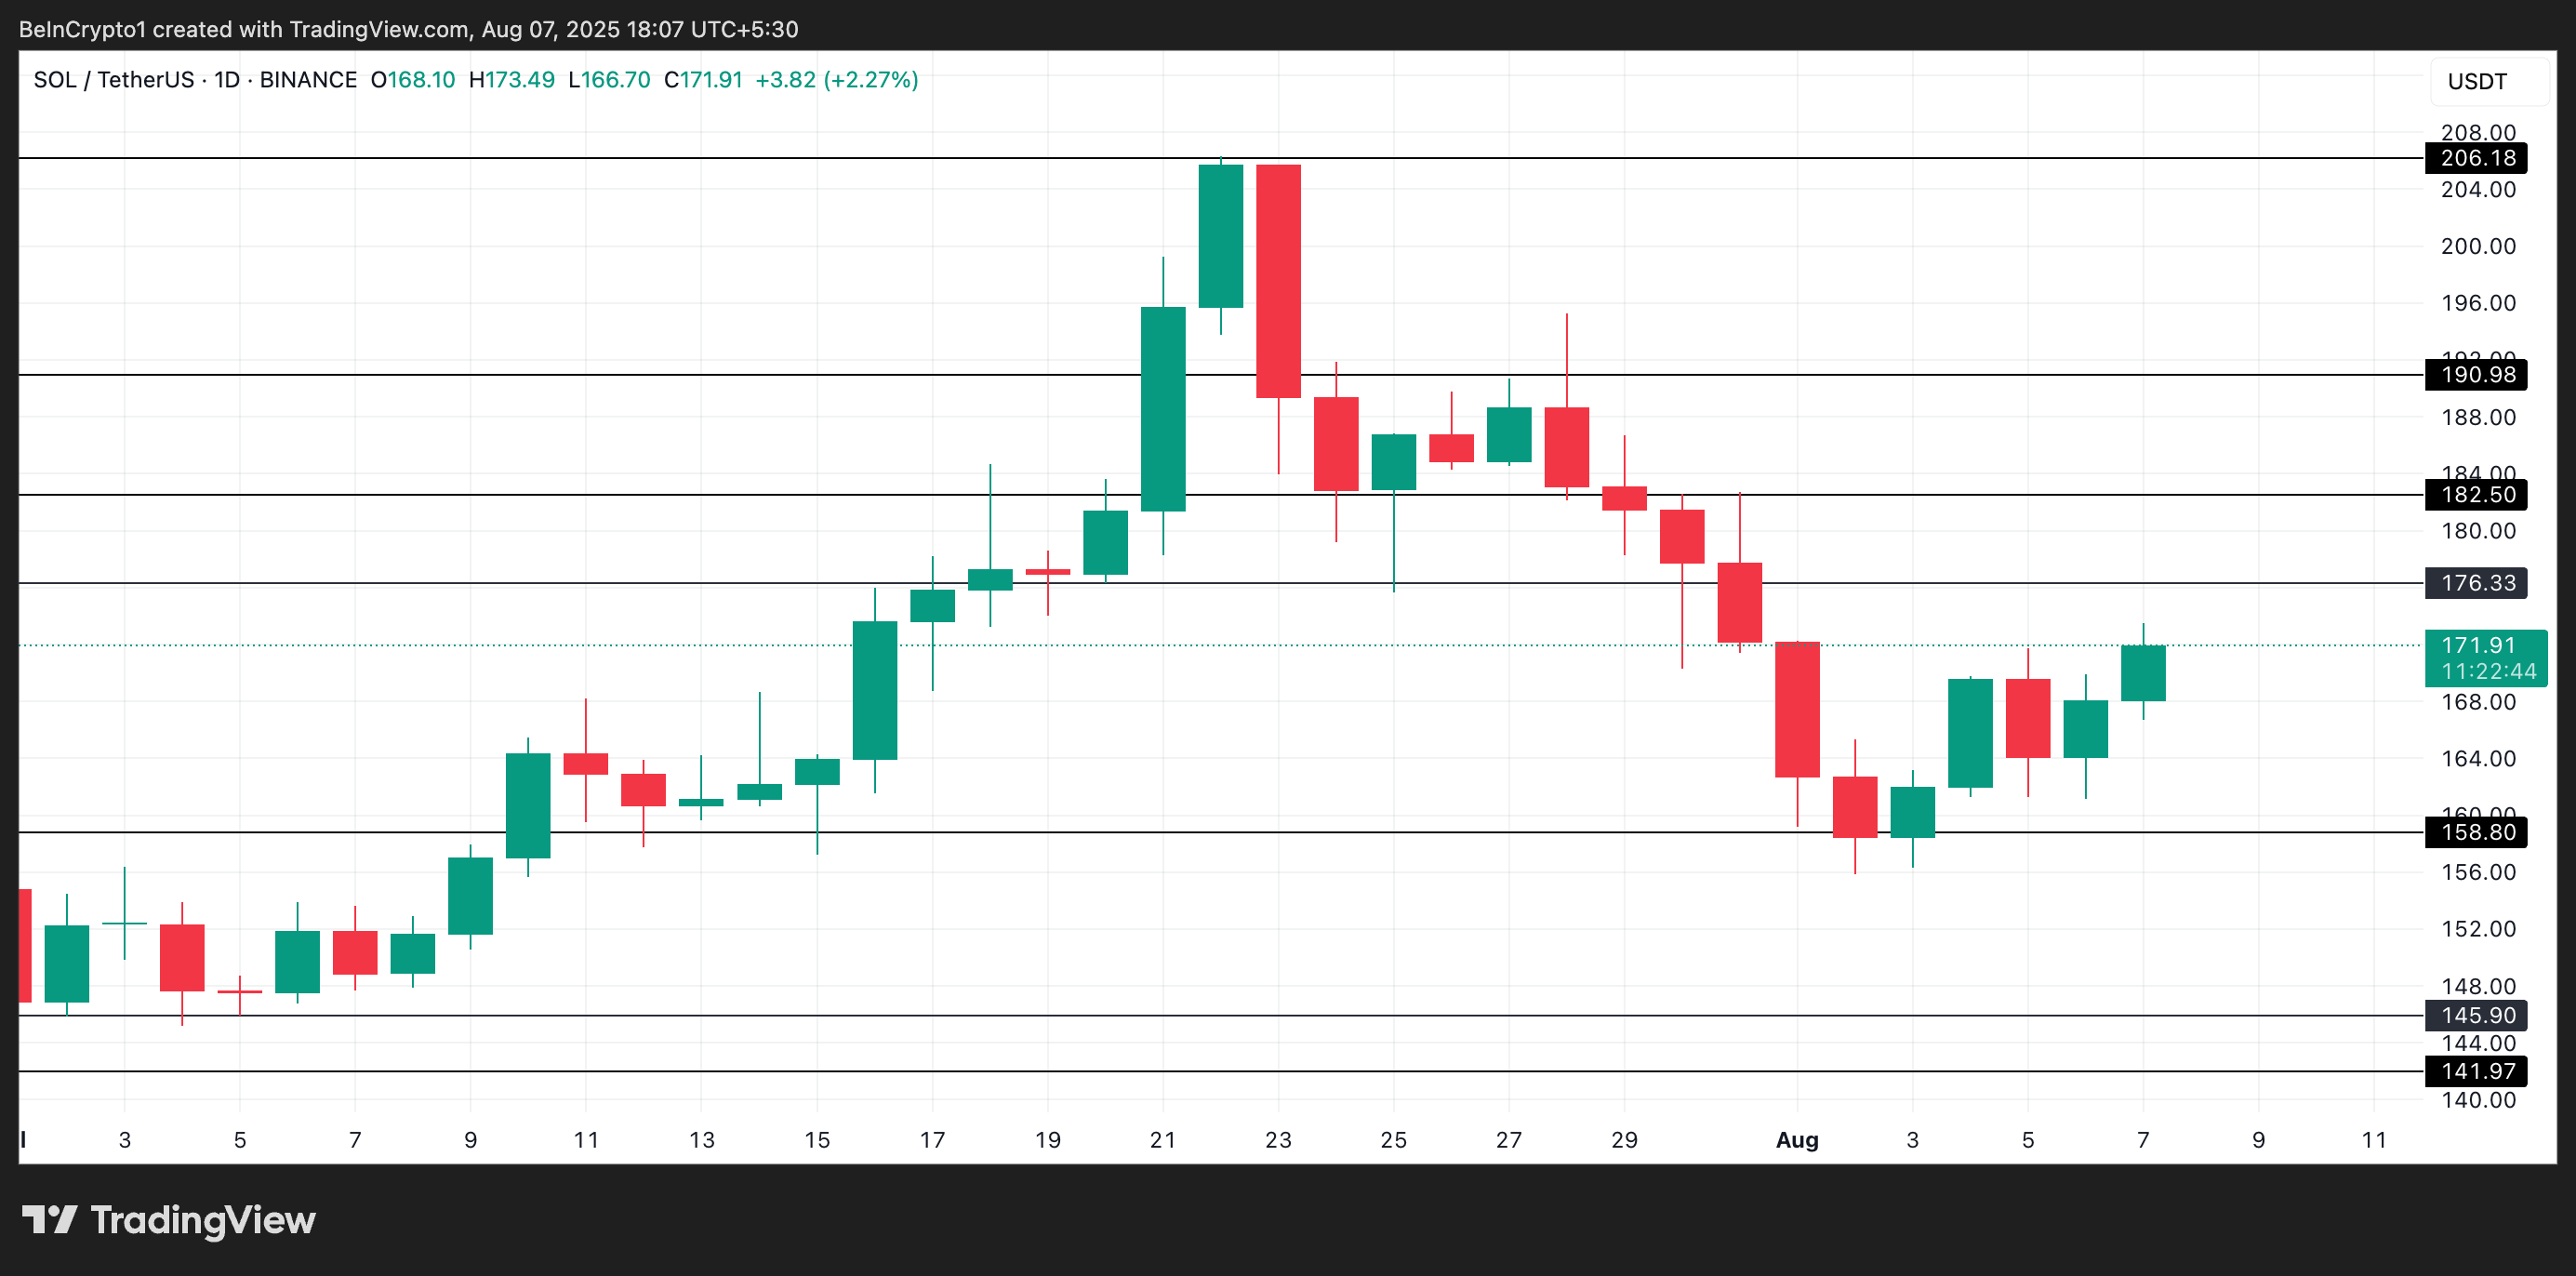
However, a shift in sentiment or renewed profit-taking could prevent this. If bears regain control, SOL’s price risks a pullback toward the $158.80 support level, erasing recent gains.
source : https://beincrypto.com