


Binance Coin (BNB) has been stuck in a tight range for weeks, barely moving more than 1% over the past month. But beneath this calm surface, a series of subtle but meaningful signals are emerging.
From increasing user participation to signs of whale activity, on-chain data hints that this sideways structure might be nearing a turning point for the BNB price, if the right triggers align.
Active Address Count is Back on the Rise
Sponsored
BNB’s active address count has been climbing steadily since early May. After slumping through much of March and April, participation began recovering, with a major higher high marked on June 20, reaching over 1.75 million daily addresses.
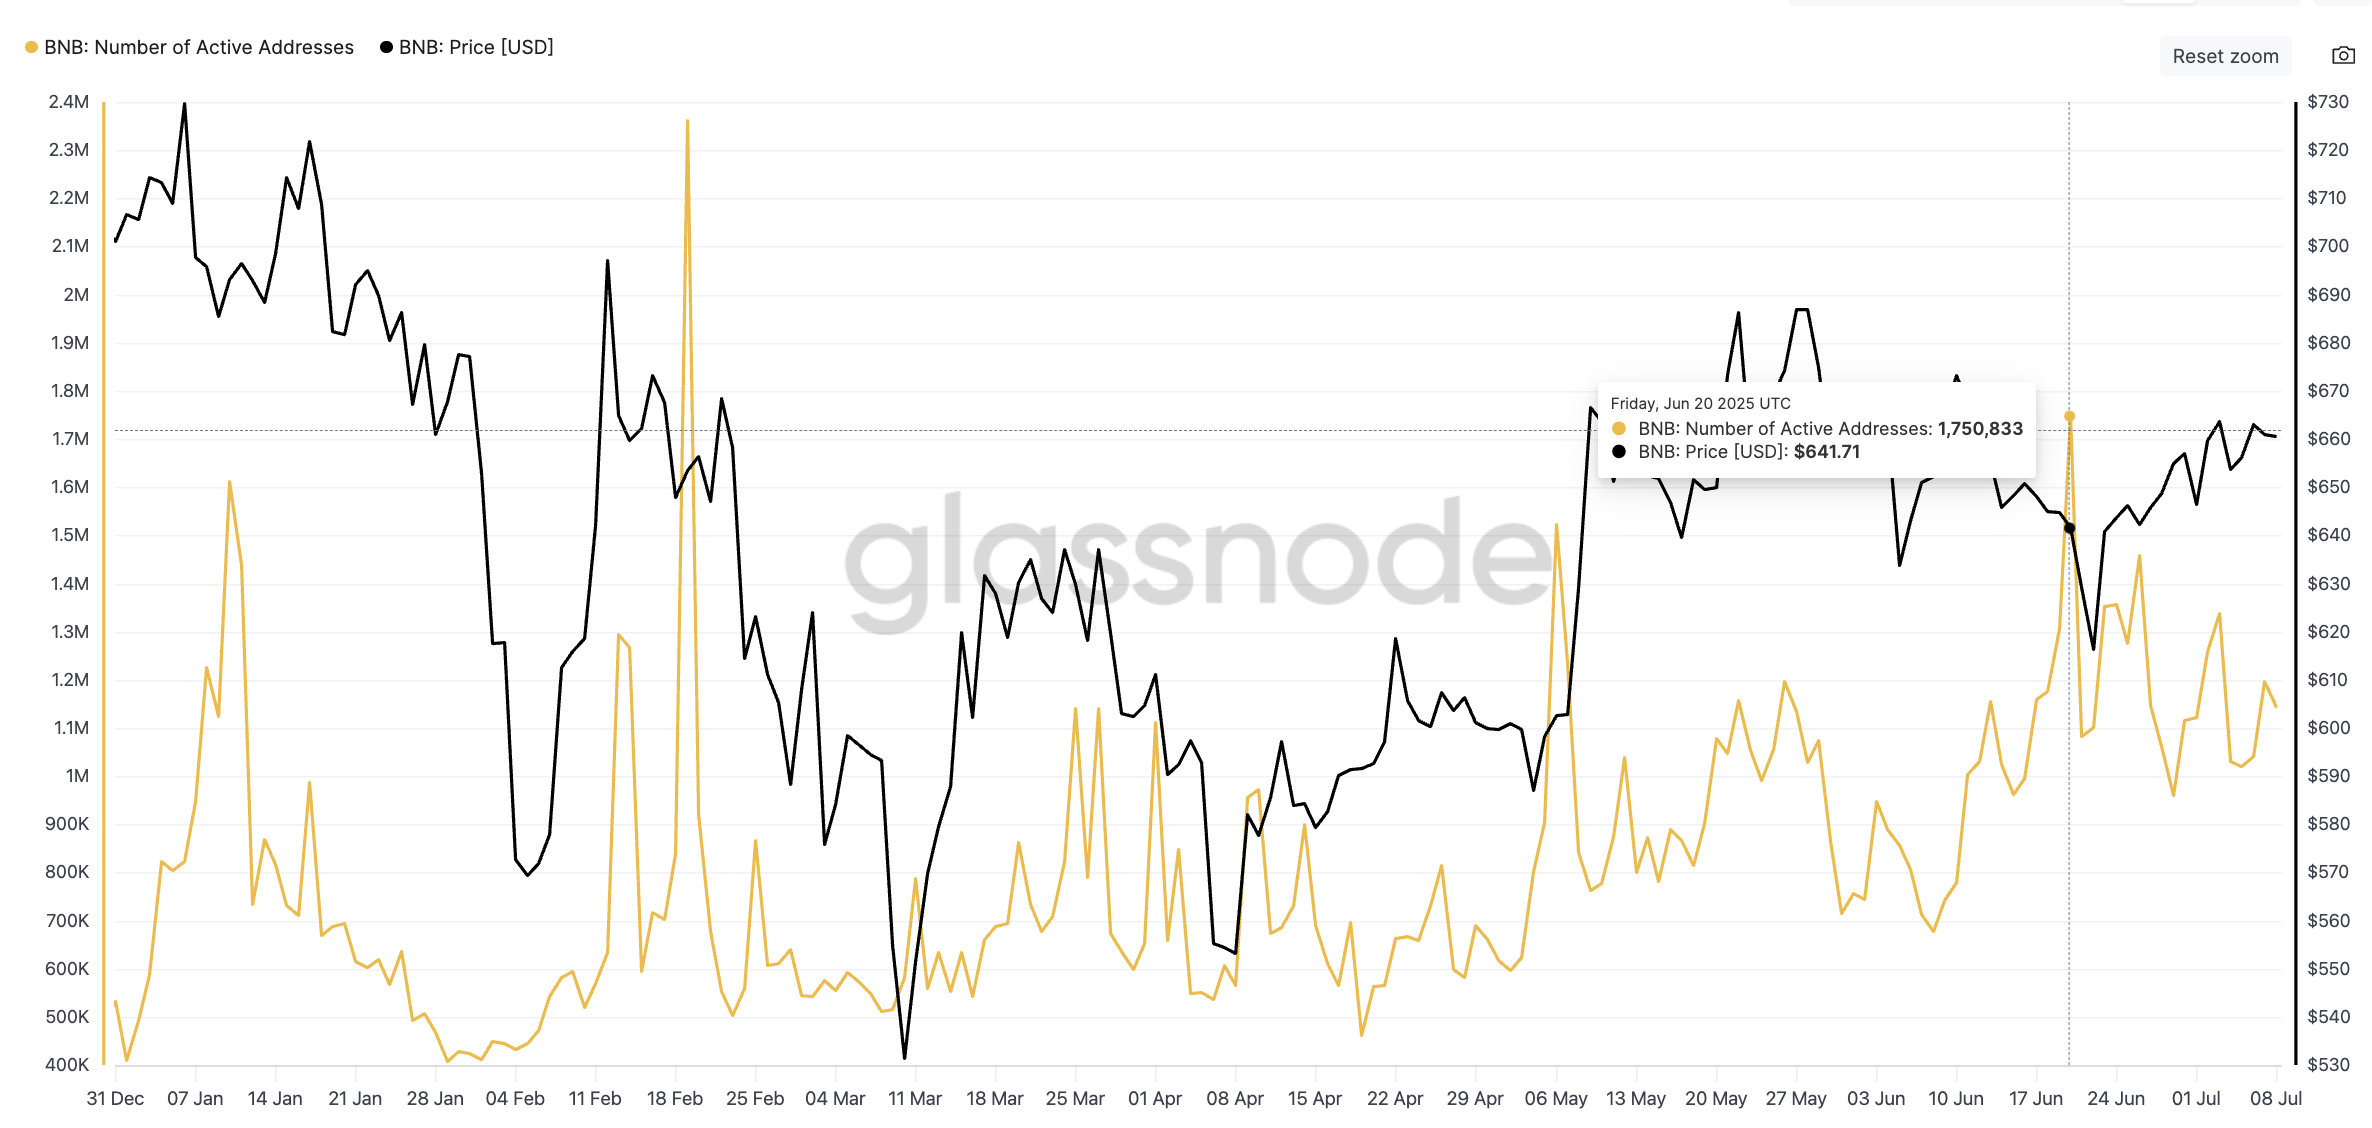
This isn’t just a sign. A rising count of active addresses suggests broader user interest, often the base for more sustainable price movements. It shows that the current consolidation isn’t entirely hollow; there’s growing organic engagement in the background.
Top 1% Wallet Spike Hints at Quiet Accumulation
Glassnode data also shows something we haven’t seen all year: a double spike in the percentage of supply held by BNB’s top 1% of addresses. These two surges, on June 21 and June 28, mark the only significant upticks in 2025.
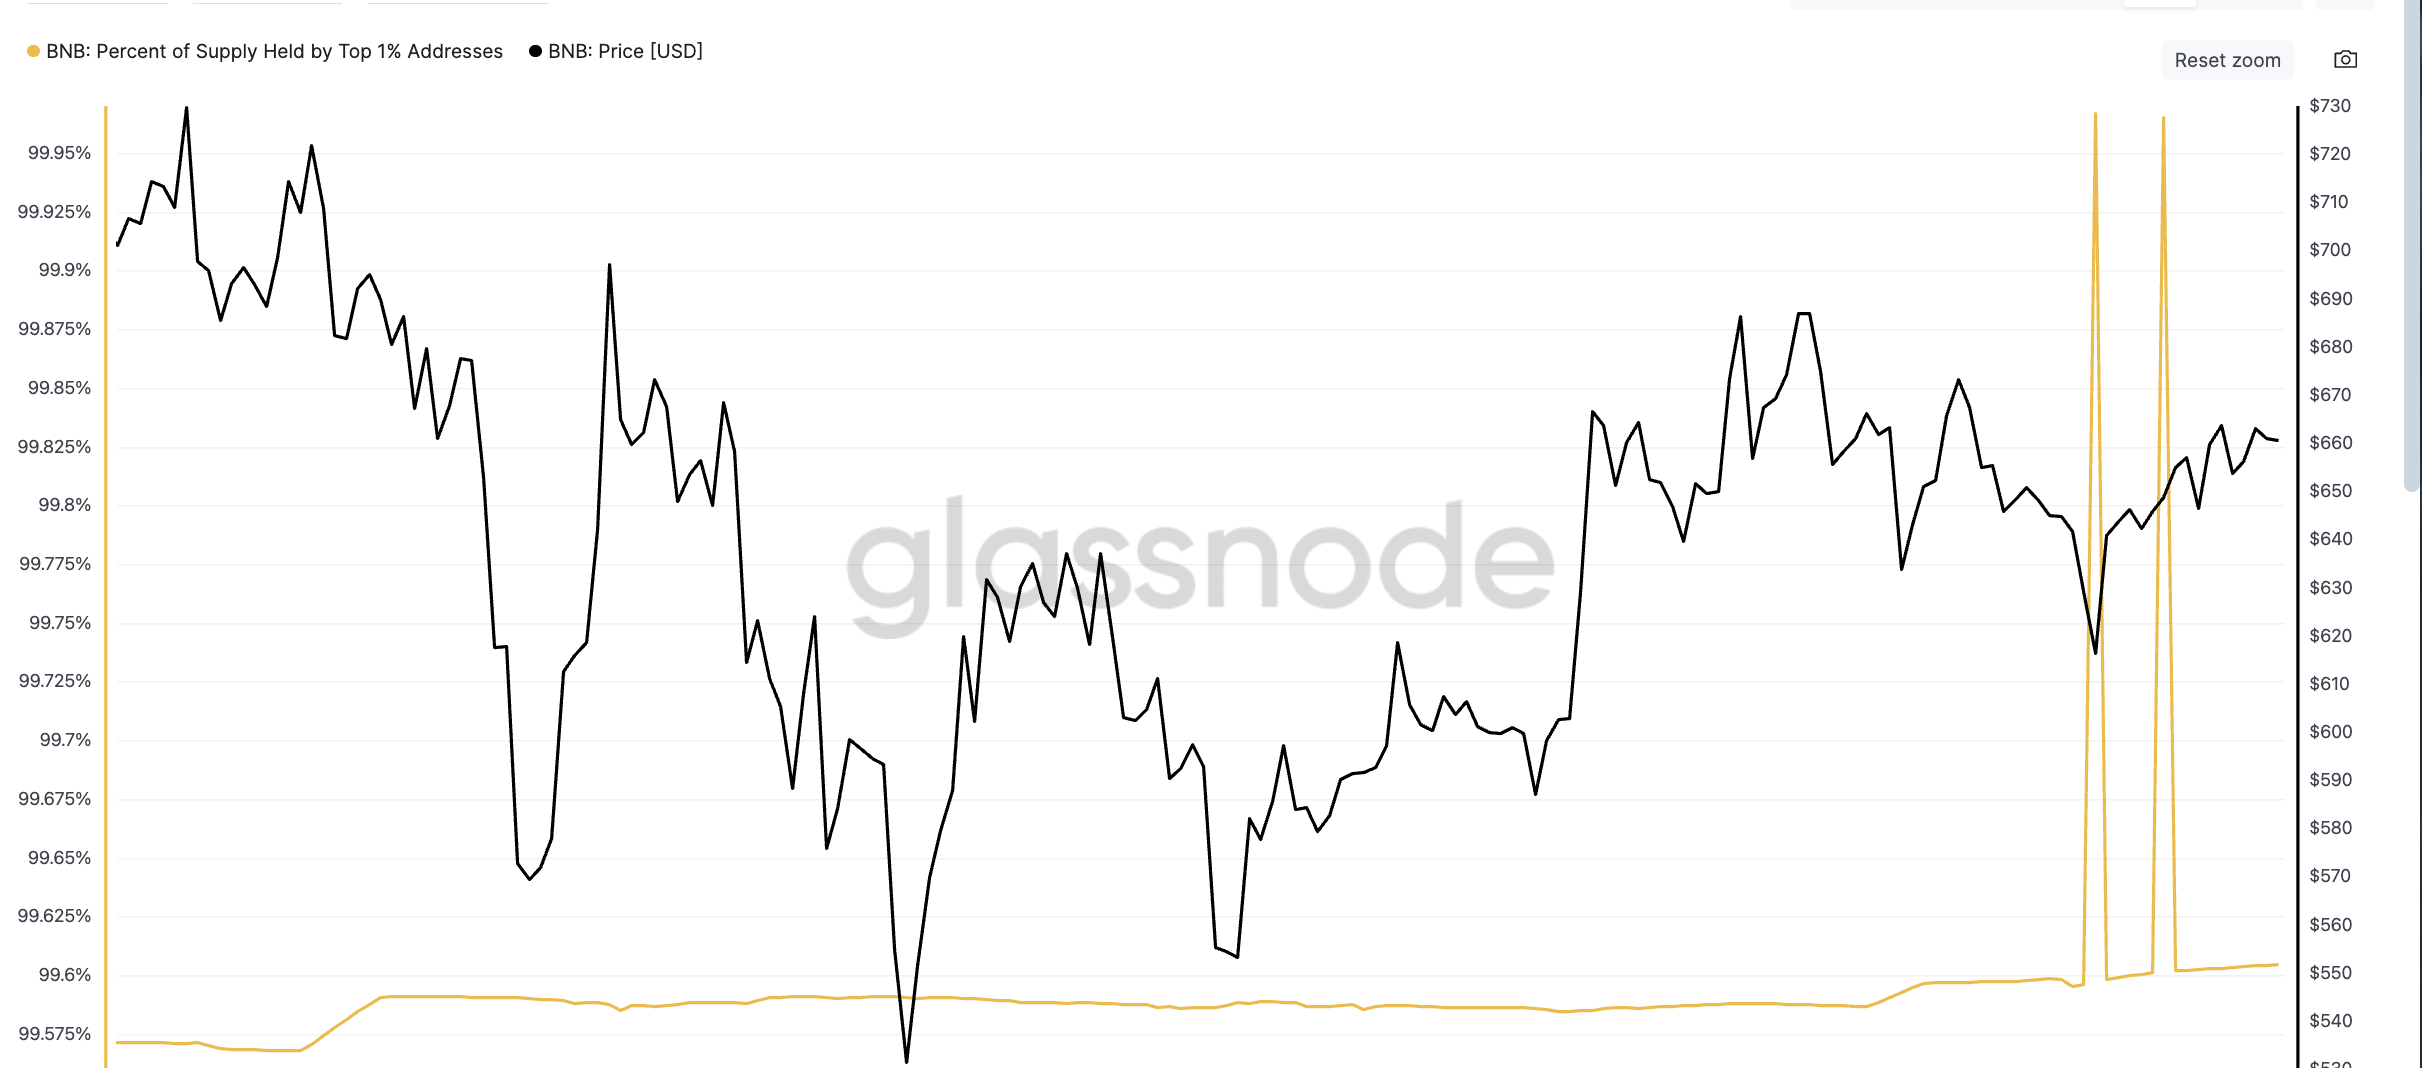
These top 1% holders, typically whales or institutional addresses, had been flatlining for months. The sudden moves could point to silent OTC buys or redistributions. These wallets usually don’t chase rallies — they build positions when the price is quiet. That aligns with BNB’s current low-volatility price structure.
The “top 1%” metric tracks the total BNB supply held by the largest addresses. A spike here signals accumulation by the biggest holders, which can precede a move, if it’s sustained.
Ascending Triangle Pattern and RSI Divergence in Motion
On the daily chart, BNB continues to respect an ascending triangle pattern, with strong horizontal resistance at $665–$693.
source : https://beincrypto.com